Previously posted - still cannot get a very VERY simple formula to add a result into a shape in a diagram.
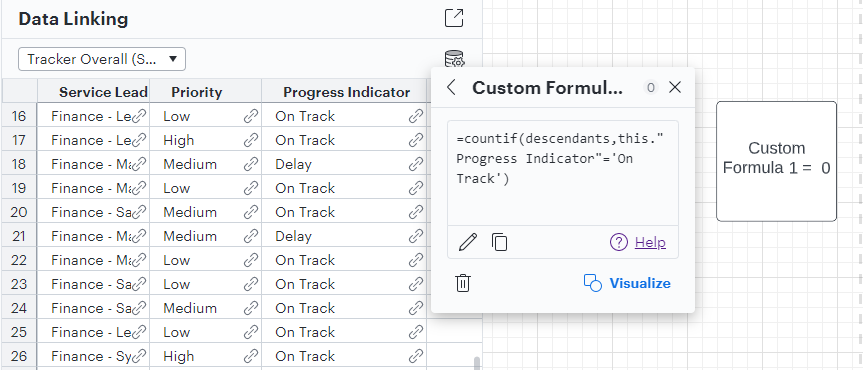
As you can see my data table is SIMPLE. My formula is SIMPLE. Clearly there are a number of rows that displays text in the Progress Indicator column that match my formula (i.e. how many rows have the phrase 'ON TRACK' as the Progress Indicator). The answer by the way is 19 rows out of a total of 38 rows in the table. Lucid Chart gets the answer as '0'.
Posted previously - followed advice and got nowhere. Weeks on and still stuck on trying to do a very very simple thing that should take less than a minute. I mean come on guys seriously my job is at stake here