I have a complex shape that has icons and varied text. Initially made from primitives it will have several text boxes etc. One the shape image is created it will be grouped. Once grouped a data source will be applied that will have properties that will populate each of the text entities and update a property on the icons that will then be colorized by a rule.
Please advise how to proceed.
Thank you
Best answer by Whittney C
Hi John thank you for that additional information. Check out this video recording of how to successfully do this.
Here is quick breakdown by step:
Drag multiple shapes onto the canvas and highlight/select all shapes
Group shapes together by right click "Group"
Double click on the group of shapes and drag a row of data onto this group.
Select desired shape and select New Data Field> Custom Data> Property 1 (=parent.Data row title)
You can choose to add the text to the shape by selecting the Text+ icon on the right hand side
Hi John thanks for commenting in our community! Take a look at our Data Linking article that will take you through how to assign data or display data on objects. In addition you can then add Conditional Formatting rules to highlight important information. Let me know what questions you have after looking over these articles and I'd be happy to help out.
Hi Whittney - thank you for the response. please note that i did follow the instruction in the Data Linking article that you recommended.
A) it was not quite what i was trying to do. This would be to create a custom shape with multiple data fields assigned to varied properties in 1 row of the data source
B) i attempted to follow the instruction by multi-selecting entities and also by first creating a group.
B.1) multi-select i then drag&drop the data row on the Data Panel upper section ... it always assigned the properties to the drawing sheet not the object
B.2) grouping. Properties were drag&drop assigned to the group. However the layout sidebar did not offer options to display the properties/meta-data values anywhere on the shape
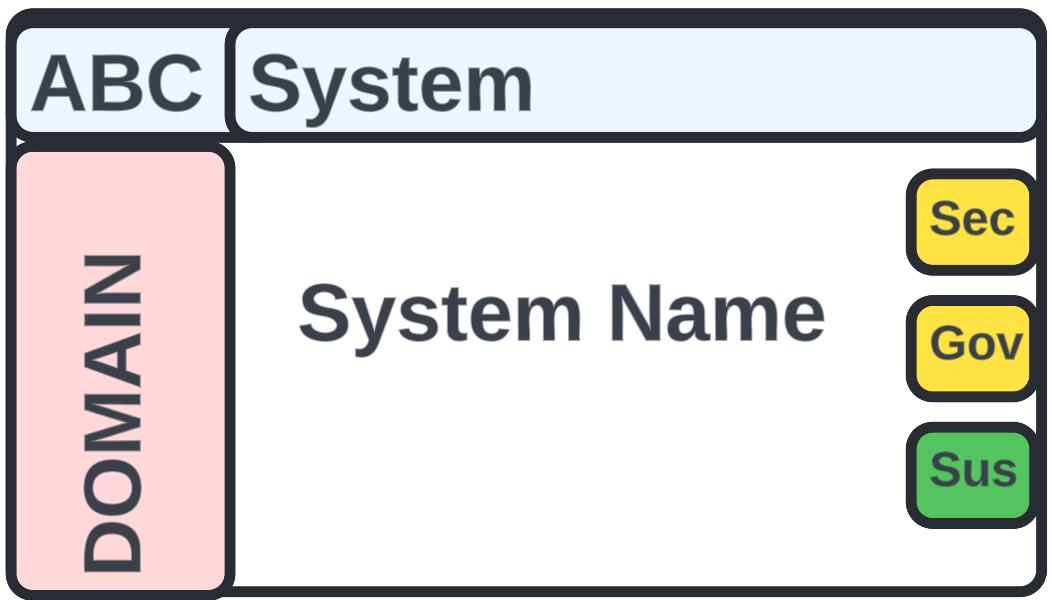
B.3) i created individual text entities within the primitives and drag&drop individual fields on those text entities and displayed the property. I then created a group of all the shapes + text. Changes in the data-source properties did reflect textual updates to the text entities within the group. However this is a one-off fix and not doable in our workflow. I need to be able to drag&drop a data-source row on the custom shape object and update each of the applicable text entities as assigned to a property. See below:
The desired scenario would be:
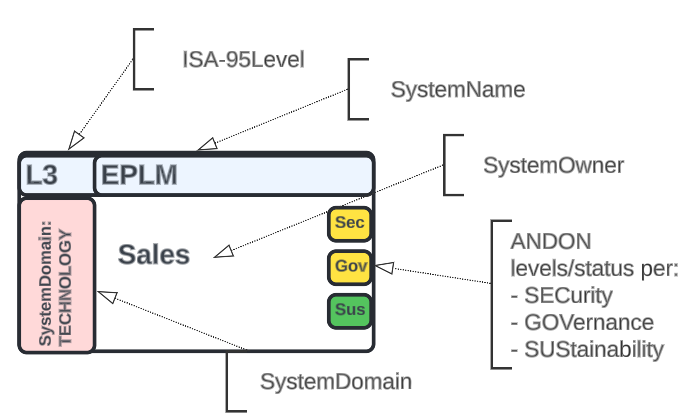
1. create the above as a custom shape where each text field has a custom property; place shape on custom shapes menu
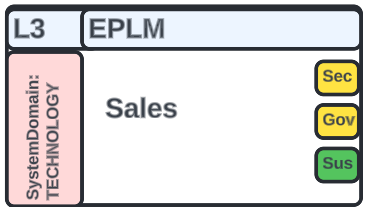
2. at design-time drag&drop the above shape to the Lucid canvas
3. next drag&drop a row from a data-panel data-source with the above properties and populate the shape properties with the specific meta-data values from the data-source thus showing the shape/object instance content as defined in the data-source row's meta-data
4. repeat the above for varied architectural element representations
Hi! I’m Micah from Lucid’s community team. 👋 I thought you, and any others who might come across this topic in the future, might be interested in Lucid’s Data Trusted User Group. This group is made up of knowledgeable users who regularly analyze and visualize data in their work. As part of this group, you’ll have the opportunity to connect directly with Lucid’s product team, gain early access to beta features, and share insights about your needs, shaping the future of Lucid’s data solutions 🎉 You can learn more and request to join here. Thanks!
Hi @john.a.lopez! I’m Jimmy, a product manager at Lucid owning all things data. You're exactly the type of person I'd love to hear from about data use in the product. Just wanted to extend a personal invitation for you to join - we'd be thrilled to learn from you.
shape-object meta-data mgmt in something other than XLS or Google sheets … like a DB or SmartSheet, maybe integration to Neo4J or other graph DB
extension of shape-object formula capabilities to reach out to outside services, so that on object metadata (and upstream or downstream) could influence a query to python service hosting an ML or LLM specialized for “insights” during runtime or during development of diagrams (ie: BPMN, UML, SysML, TOGAF, etc.)
per #2 “reactive” graphing to create digital-twin of process (BPMN) and architecture (as in infrastructure) based on runtime query to outside services that yield metric from “live” process runtimes and/or infrastructure interrogations
PS: don’t have time for a big DEVOPS project to create an integrative extension to Lucid via your development environment … need it to work, with admin controls OOTB. Thanks
A Lucid or airfocus account is required to interact with the Community, and your participation is subject to the
Supplemental Lucid Community Terms.
You may not participate in the Community if you are under 18. You will be redirected to the Lucid or airfocus app to log in.
A Lucid or airfocus account is required to interact with the Community, and your participation is subject to the
Supplemental Lucid Community Terms.
You may not participate in the Community if you are under 18. You will be redirected to the Lucid or airfocus app to log in.