Hi Elizabeth
Thank you for posting your question in the Lucid Community! There's another formula you can use that will not recalculate if you collapse part of your org chart. Please follow these steps to implement the formula:
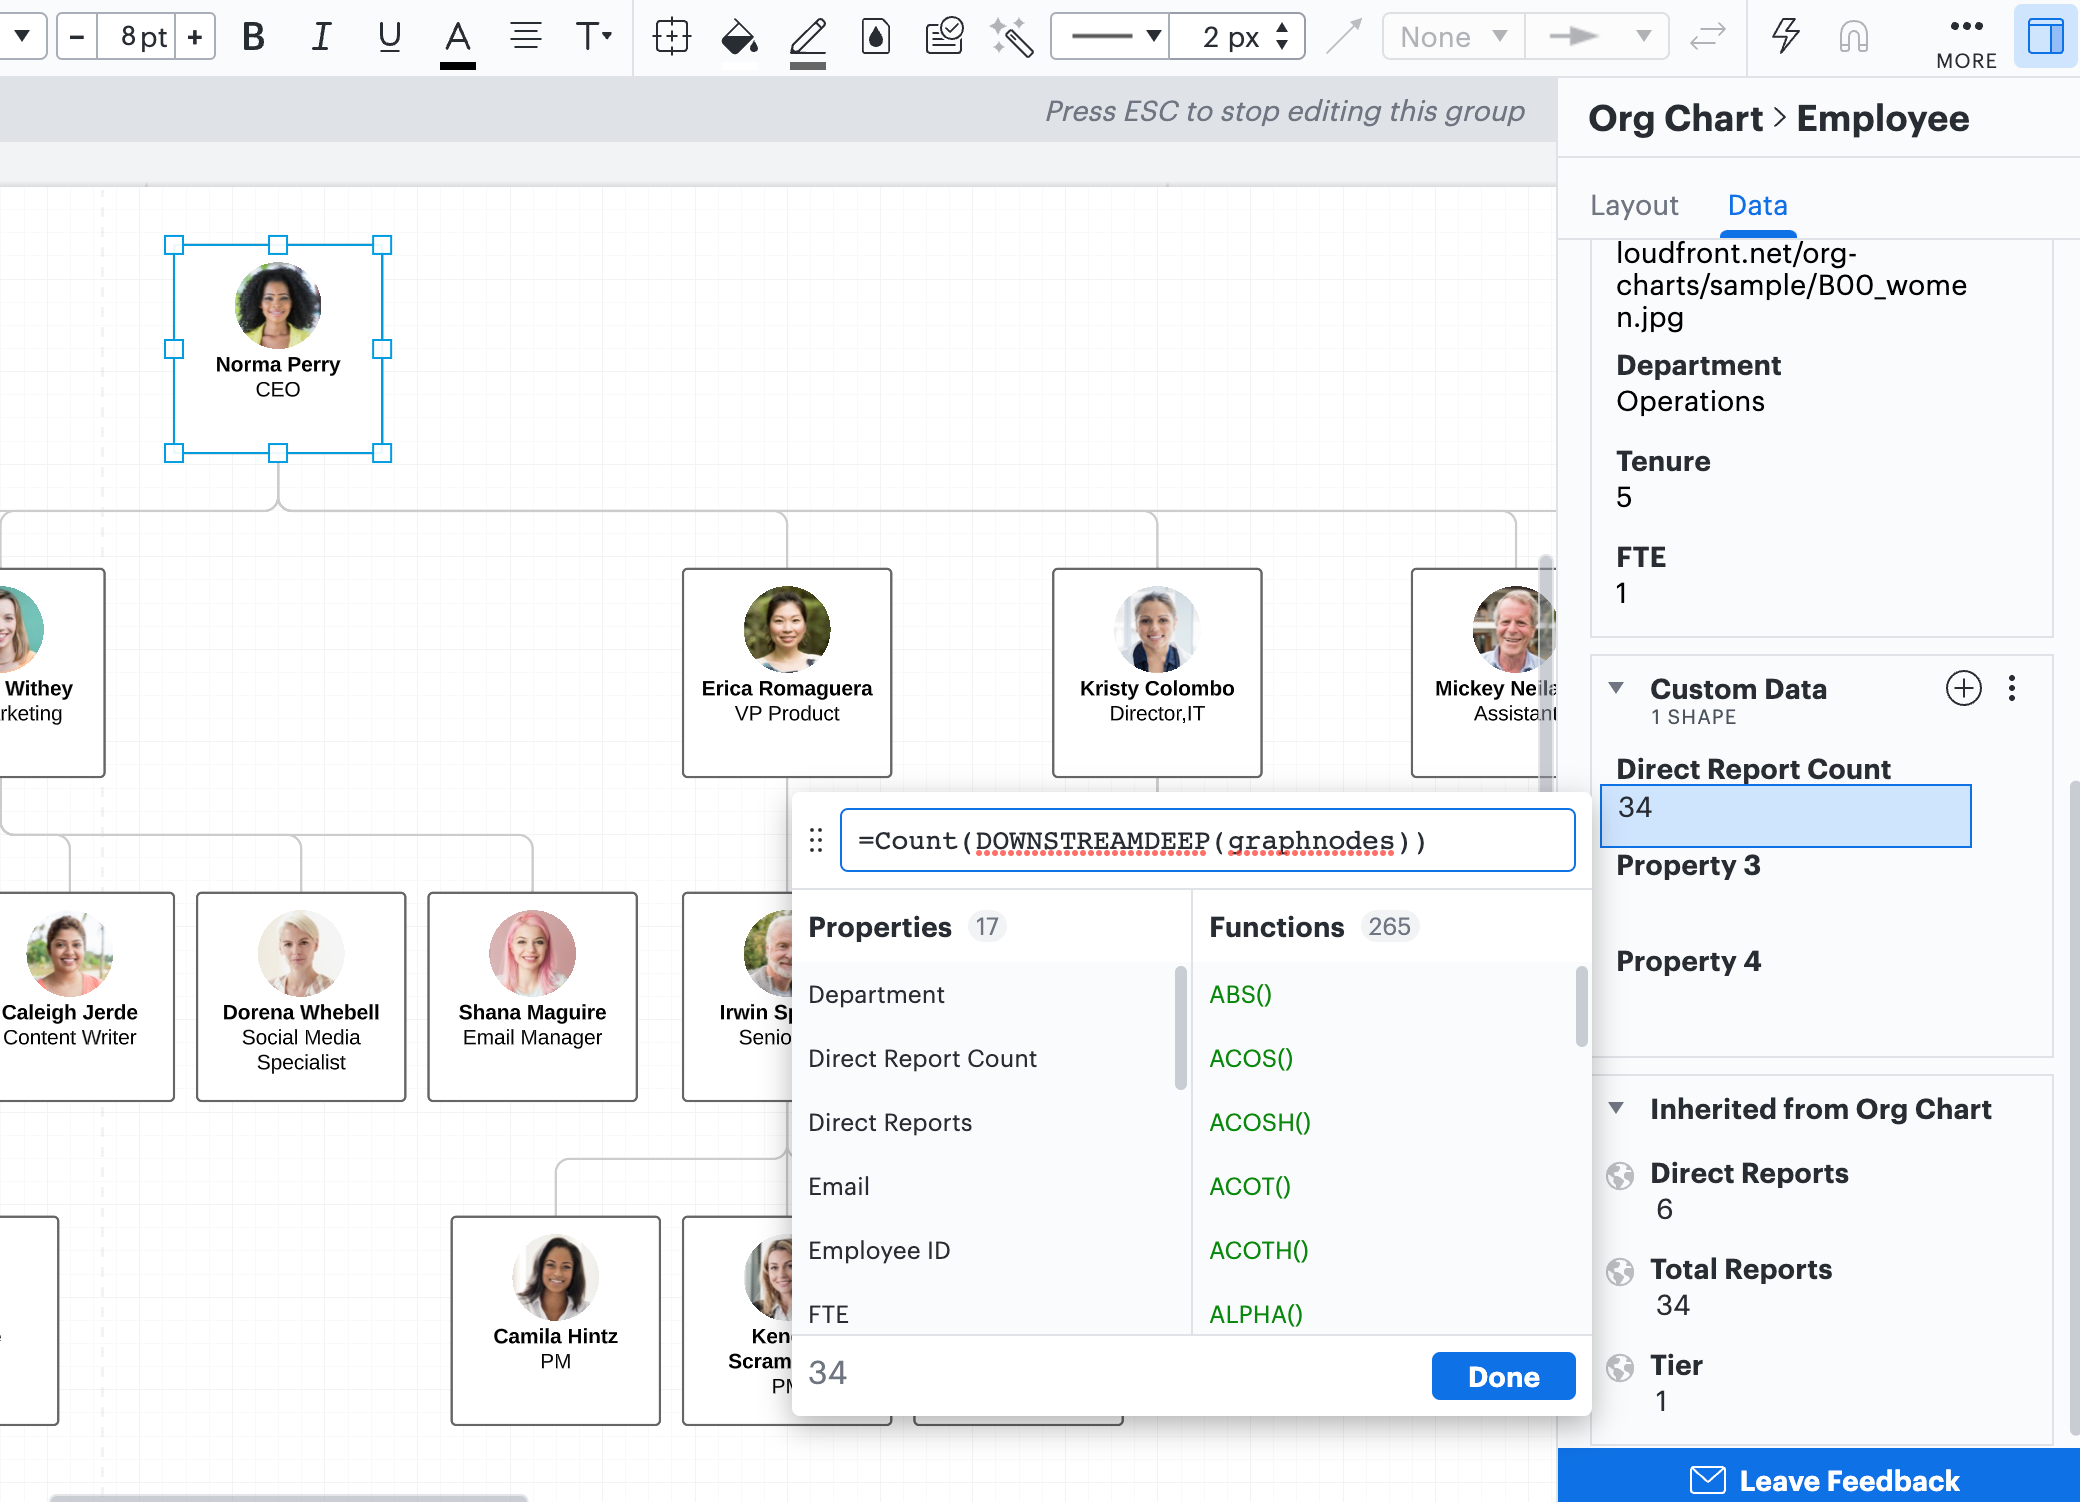
1. Select the top shape or tier 1 employee in your org chart (typically the CEO President or primary leader)
2. Open the Contextual Panel select the Data tab and scroll down to Custom Data
3. Click the plus sign to create a new data field. Title it "Direct Report Count" and use this formula to calculate the value:
=Count(DOWNSTREAMDEEP(graphnodes))
The amount of total direct reports or FTE there are up to this first employee will calculate.
To visualize this number in a shape on your document you can use two more formulas:
The first formula will generate the name of the shape that is displaying your tier 1 employee.
1. Select the top shape or tier 1 employee in your org chart (typically the CEO President or primary leader)
2. Open the Contextual Panel select the Data tab and scroll down to Custom Data
3. Click the plus sign to create a new data field. In this data field you can title it "Name" and use the formula
=label(this)
to generate the shape's name. Copy this "name" (in this example the generated name is: AVmTdNukrIhuOSQO/RdDmlQ7rXg=) so you can use it in the next formula.

The second formula will be used to display your total FTE in a shape outside of your org chart.
This formula is not contingent on which shapes are visible and won't change if you collapse or expand parts of your org chart.
1. Select the shape
2. Open up the shape's contextual panel select the Data tab and open up Custom Data
2. Create a new data field and use the formula:
=#"paste the shape's name here"."Direct Report Count"
3. To visualize this value you can select the T+ on the righthand side of the data field to see it displayed in your shape

I hope this helps! Please let me know if you have any additional questions.