I have recently started using lucid chart for project management purposes. I have my raw data in a google sheet and I have manually drawn all the tasks on a lucid chart page using oval shapes. The raw data contains information like task owner task members description etc. The horizontal length of a shape and specific placement in lucid chart page represents the start and end dates. Each row in the raw data from google sheet corresponds to one shape in the lucid sheet. I have multiple questions on lucid chart capabilities for this use case:
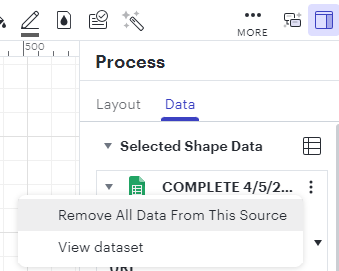
1) I have been able to drag and drop a row of data from the important google sheet to a shape and it works fine. However I am not not able to "unlink/reset" this linking of shape and row for some of the shapes. I might sometimes want to do this. Is this possible?
2) Upon adding an additional column to the google sheet from where data was imported the rows need to be manually re-associated to the shapes. Is there a way to automate this?
3) I would like to place text corresponding to the task name and task owner cells (available in raw data) inside the shape and then have the text size automatically re-sized so that the text doesn't get hidden due to lack of space in the shape. I know the former is possible (placing raw data cells inside the shape) but is the later auto-formatting possible/supported?