Hello,
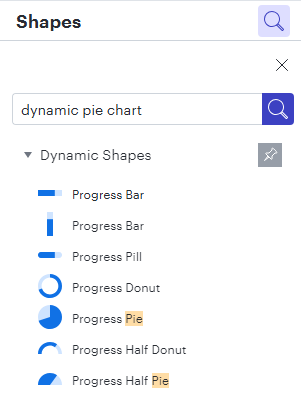
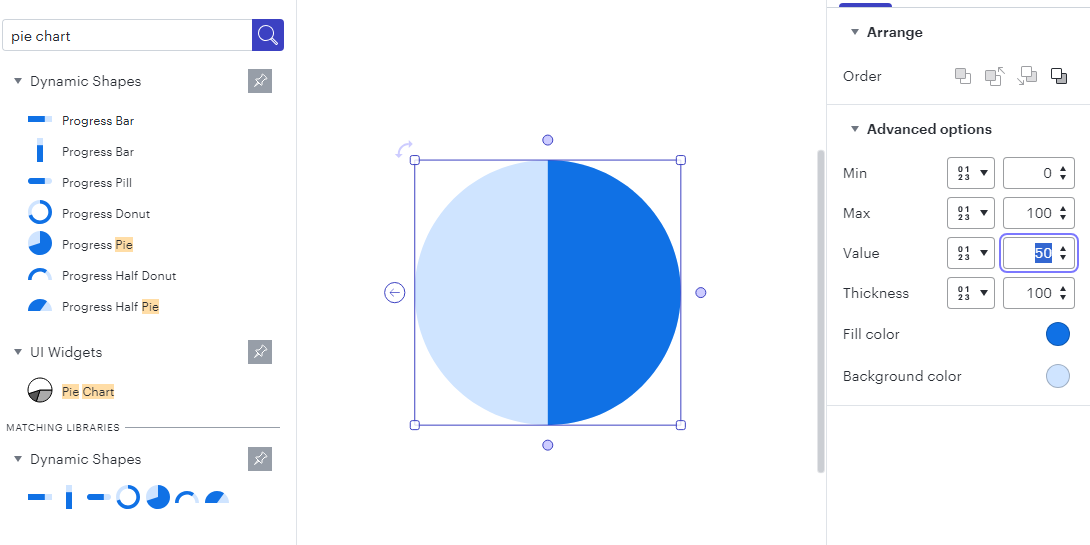
I have seen there is a Pie Chart object, but being honest it is not as good as Visio, and wondered if you can point me in the right direction to reproduce the following:
And with Boxes (with the same coloured segments)
I cannot seem to do either in Lucid, and currently having to create the circles in Powerpoint. Though no current way of making the (coloured) squares, unless I use Visio.
Any help would be greatly appreciated.
Thanks in advance.