Solved

How to arrange and style shapes based on imported data

  • November 11, 2025
  • 10 replies
  • 77 views

Forum|alt.badge.img+1

I am importing data from an excel spreadsheet into LucidChart.

I need to import several hundred rows of data into the chart.

Each row in the spreadsheet must appear as a rectangle in the chart.

Each rectangle should contain the contents of each cell in the corresponding row.

How do I set up the import so that each rectangle will be:

a) certain dimensions (or autofit)

b) a certain distance directly below the rectangle corresponding to the prior row

c) in the same order, stacked vertically, as the rows in the excel spreadsheet.


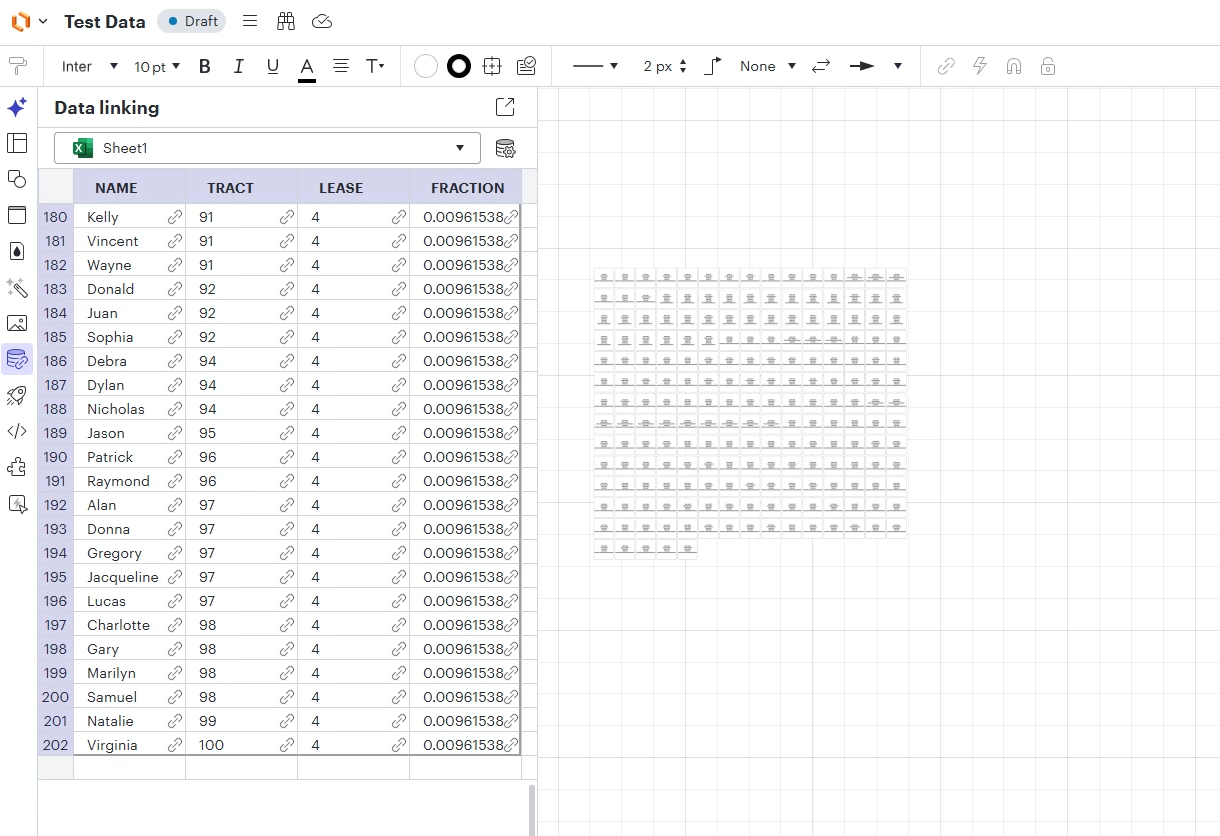
Currently the imported data appears with the rectangles arranged in an n x n matrix, instead of in a single vertical file.

Best answer by Ambar D

@LucidCharter

As you’ve discovered and mentioned here, Draw.io files can be saved as .drawio or .xml files. You can then import either of these file formats into Lucidchart, but they must have been exported from Draw.io.

Unfortunately, at this time, Lucid does not support the import .xml files that were exported from other tools.

Comments

Ambar D
Forum|alt.badge.img+10
  • Lucid community team
  • November 12, 2025

Hi ​@LucidCharter, thanks for posting in the Lucid Community!

Would you mind providing a screenshot of how your imported data currently appears in Lucidchart?

If you rather not share a screenshot, could you share a temporary Document Support PIN for this document? This will help me take a closer look at what’s going on. This PIN is safe to post in this thread because it is only accessible by members of the Lucid support staff. You can find steps for generating a Support PIN in this Lucid Help Center article: Generate a Lucid Support PIN

I also first recommend reading through these resources:


Forum|alt.badge.img+1
  • Author
  • November 12, 2025


Forum|alt.badge.img+1
  • Author
  • November 12, 2025

As shown in the screenshot of the test data above, when I select the rows needed and drag them onto the lucid chart, they appear in a 2-d matrix -- n rows x n columns. I would like them to appear in a single column, in the same order that the rows appear in the imported data.


Ambar D
Forum|alt.badge.img+10
  • Lucid community team
  • November 17, 2025

Hi ​@LucidCharter, thanks for sharing this information and the screenshot. Sorry for my delay here. 

Could you share a temporary Document Support PIN for this document? This will help me take a closer look at what’s going on. This PIN is safe to post in this thread because it is only accessible by members of the Lucid support staff. You can find steps for generating a Support PIN in this Lucid Help Center article: Generate a Lucid Support PIN


Forum|alt.badge.img+1
  • Author
  • November 18, 2025

iud2iz4x9l7ilO8NGXzVM2rDKRZnDphIUn160998328


Ambar D
Forum|alt.badge.img+10
  • Lucid community team
  • November 19, 2025

Hi ​@LucidCharter, thank you for sharing that PIN!

I recommend reading through this resource: assign data to document components. Once you have imported a dataset, you can assign data to objects, groups of objects, or to your document as a whole.

To assign data to an object, follow these steps:

  1. Click data-panel-icon-in-lucidchart.png the Data Panel icon from the Primary Toolbar to the far left-hand side.
  2. Locate the cell or row of data you would like to assign to an object on your canvas. 
  3. Drag and drop the cell or row of data onto the object.

Note that when dragging data to a shape, it won’t auto-display. Instead, the linked data appears in the right toolbar. You can choose what appears on the shape by clicking the “T” icon to display data on document components

If you still have trouble formatting your document after trying these steps, please let me know and I’d be happy to continue helping here!


Forum|alt.badge.img+1
  • Author
  • November 19, 2025

Ambar, thank you for your response. I have read the material referenced in the recommended links. However, it is not relevant to my inquiry. I think my original question must not have been clear. I will re-state it below:

In the screenshot above, the imported dataset has already been assigned to objects on the canvas. Each shape has already been assigned the required data, and each shape is formatted correctly. The data is displayed correctly on each shape.

However, the 200 shapes are arranged inconveniently in an 2-d matrix, with 15 columns and 14 rows, rather than in a 1-d matrix, with 1 column, and 200 rows. I want the shapes to be arranged in a single column, and I want them to appear in the same order as the rows in the imported data set. Can this be done automatically? If so, how?  


Ambar D
Forum|alt.badge.img+10
  • Lucid community team
  • November 20, 2025

Hi ​@LucidCharter, thanks for clarifying those details, and sorry for any confusion here.

Unfortunately, this isn’t currently supported in Lucid. The closest option is using Lucidchart’s CSV import for process diagrams to create flowcharts quickly from a dataset, as described in this article. However, if you’re not importing data from a CSV to create a process diagram, there is not currently an option to automatically generate and format a diagram to the format you’re describing.

Sorry the confusion. We’re very interested in your feedback and committed to continually improving our products. If you’d like to leave feedback on this specific feature, we’d love to hear from you- you can create an idea , which will go into the Product Feedback section of this community. This will also allow other users with similar requests to discover and upvote it, then add details of their own. Our product team reviews comments within that section of the community as they research new features and product enhancements. 

Finally, for more information on how Lucid manages feedback via this community, take a look at this post:


Forum|alt.badge.img+1
  • Author
  • November 20, 2025

Ambar,


Thank you for responding to my updated, clarified question. I have read the csv import article you mentioned and will experiment with it in the future.

I will also see if lucid now supports uploading an xml file containing all of the details of the diagram. In the past, I think it did not, and so my workaround was to upload an xml file of the needed diagram to draw.io, and the convert the draw.io file to lucid, which was cumbersome.

Regards and thanks.


Ambar D
Forum|alt.badge.img+10
  • Lucid community team
  • Answer
  • November 20, 2025

@LucidCharter

As you’ve discovered and mentioned here, Draw.io files can be saved as .drawio or .xml files. You can then import either of these file formats into Lucidchart, but they must have been exported from Draw.io.

Unfortunately, at this time, Lucid does not support the import .xml files that were exported from other tools.