Hi All-
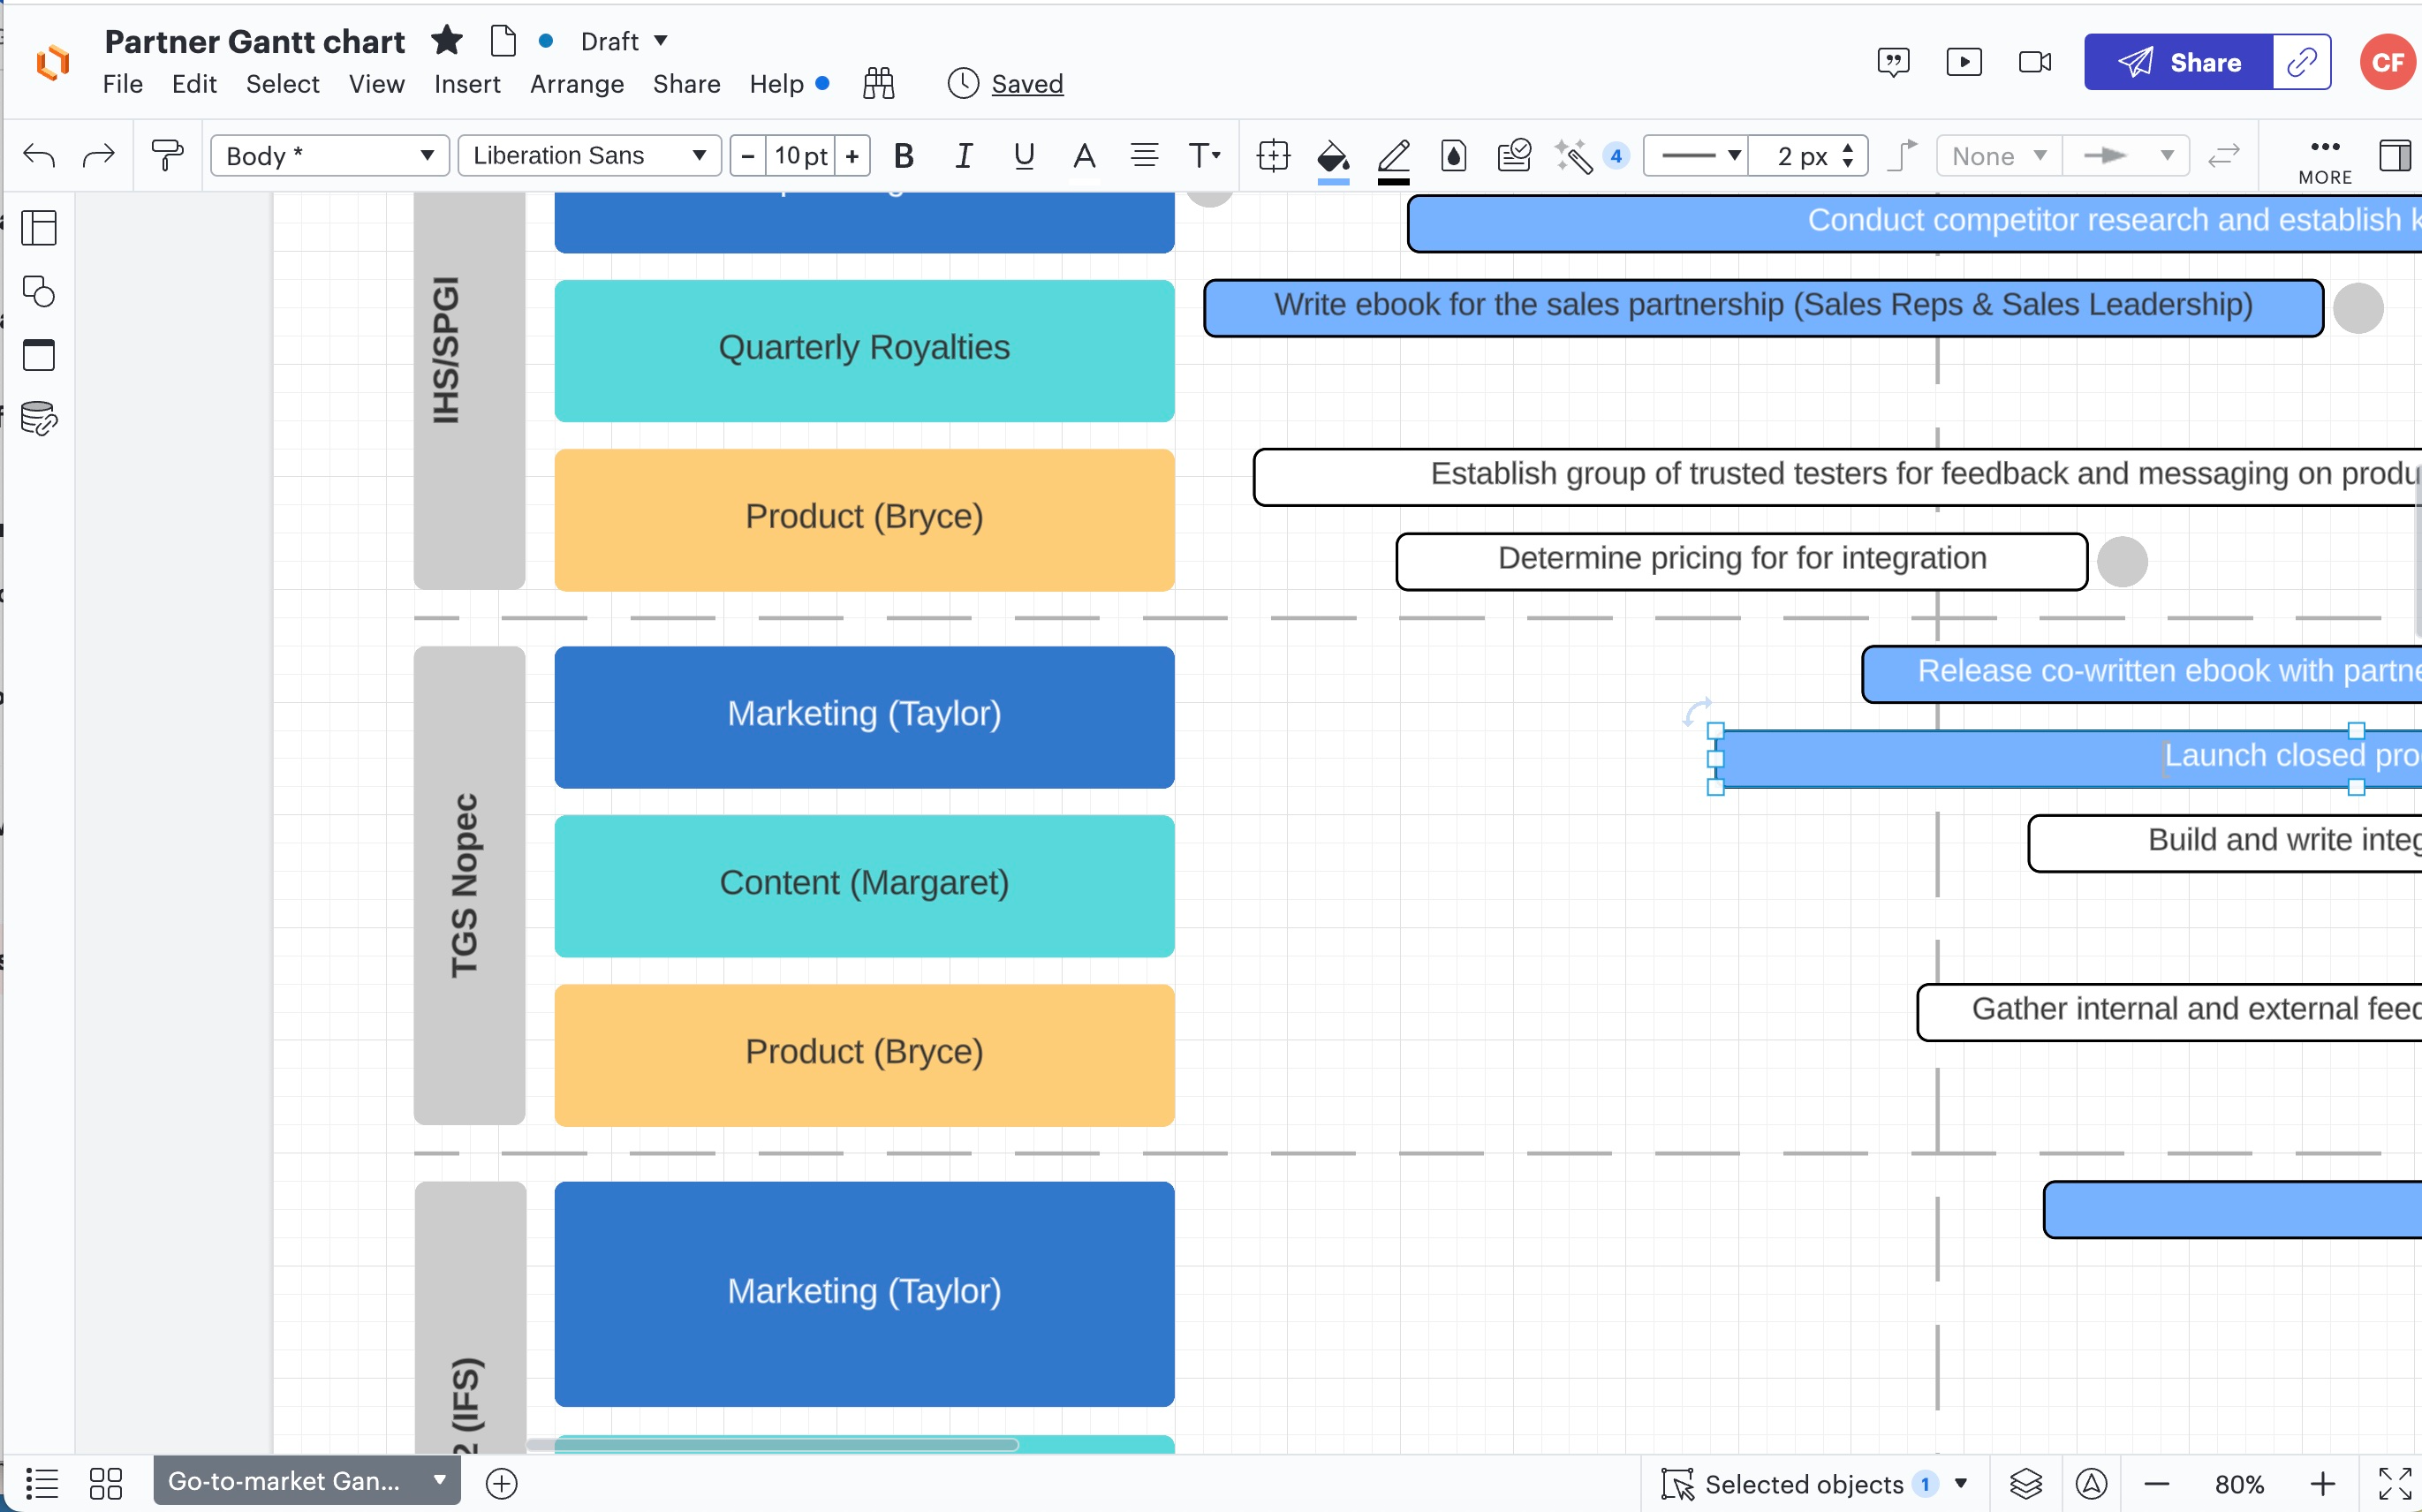
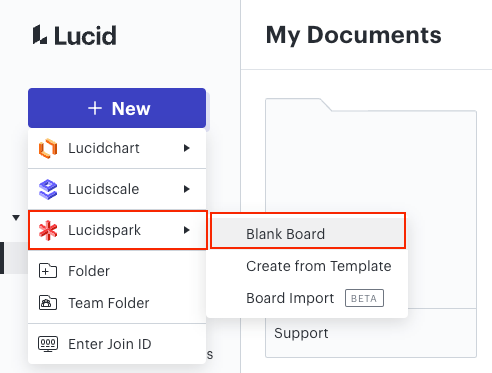
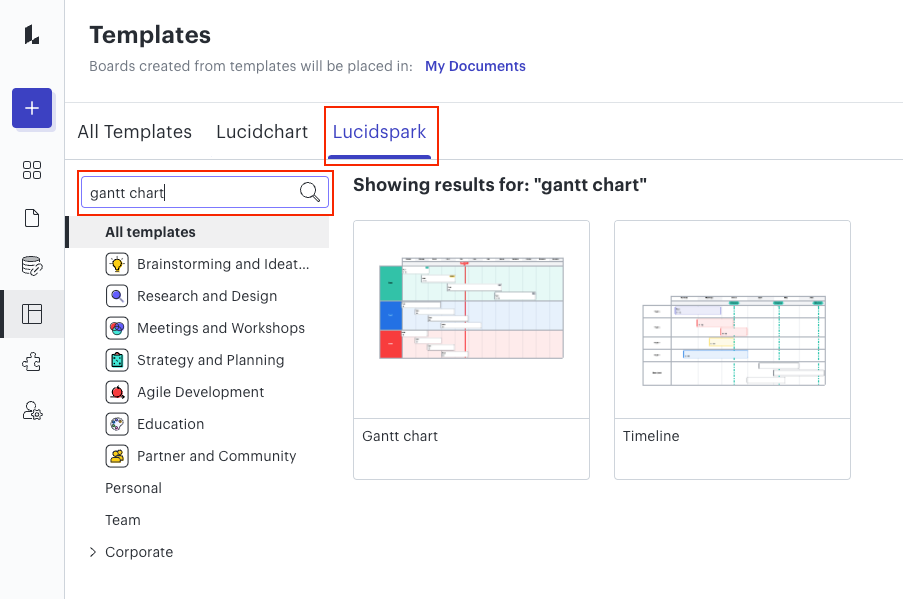
I'm new to Lucid Chart so sorry if this is a dumb question. I've found templates for Gantt charts in Lucid but I don't get how to set up the elements so that it is represented in a timeline with a starting month (or quarter) and an ending month (or quarter). Is there some tutorial on buiilding a Gantt chart for Lucid noob's like me?
thanks
Claude