Hi Lucid-Community,
I am experiencing an issue with the Excel 365 integration in Lucidchart.
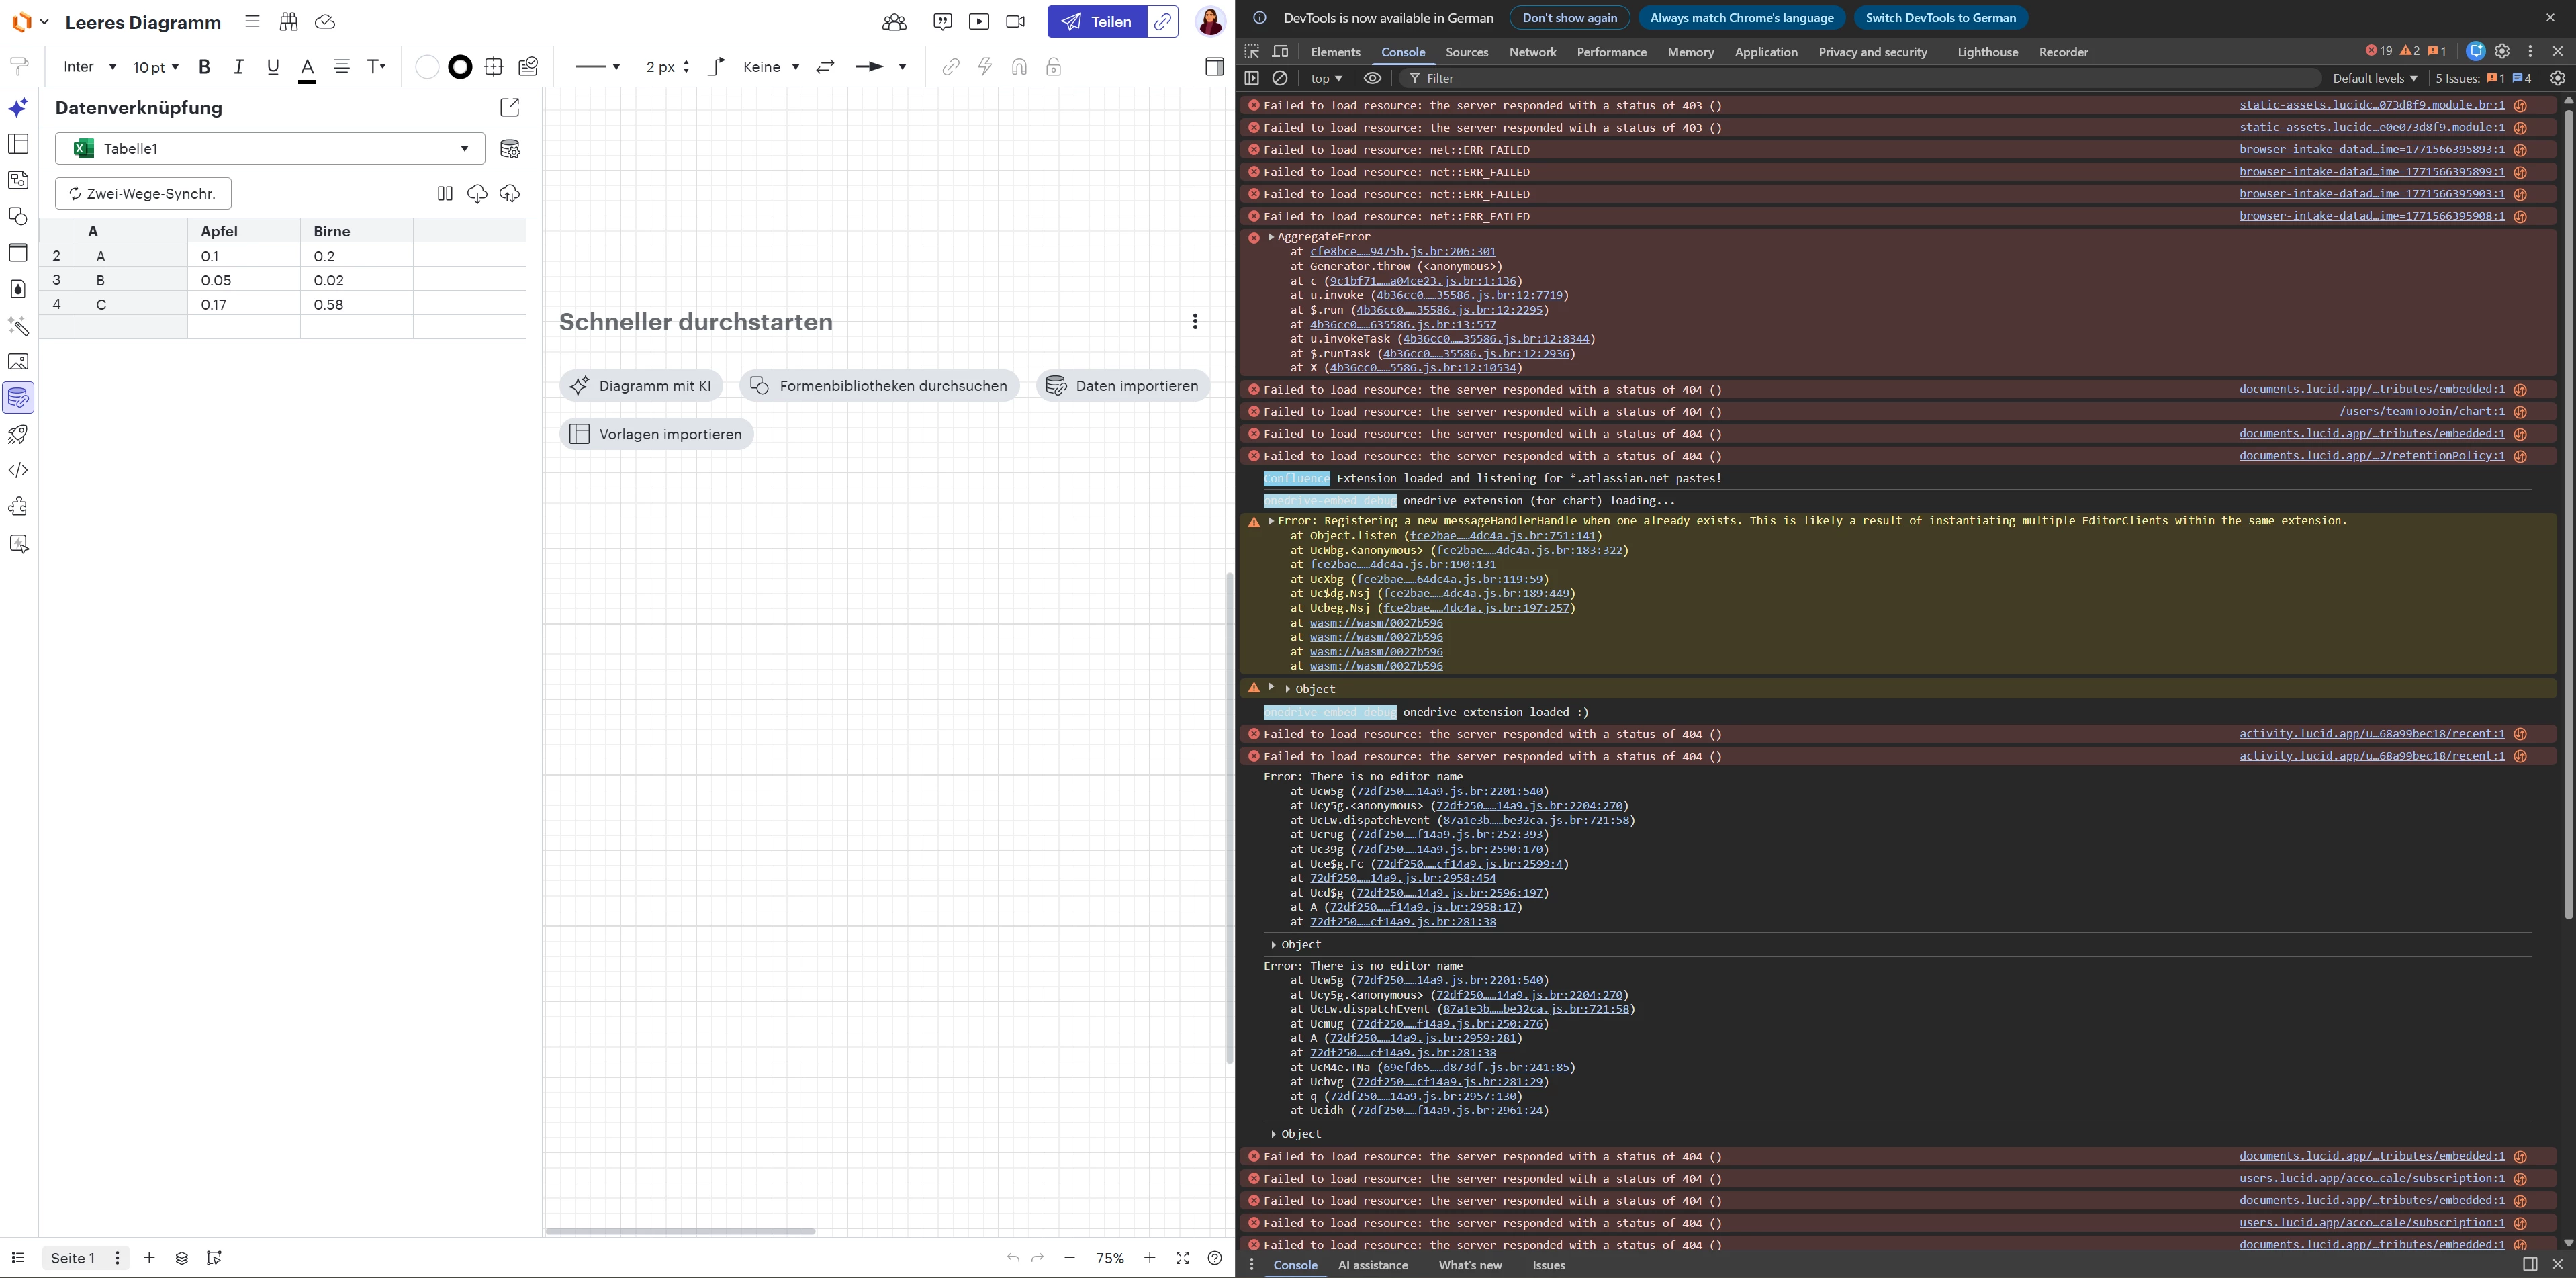
I have linked an Excel 365 file to my Lucidchart document and connected several shapes to the data. The synchronization itself works correctly, but percentage values are not displayed as expected in Lucid.
Percentage values from Excel are shown as decimal numbers in Lucid instead of percentages.
For example: → 15% in Excel is displayed as 0.15 in Lucid.
To display the correct percentage, I currently have to manually apply a formula or formatting to each field in Lucid, which is quite time-consuming.
Is there a simpler or automatic way to ensure that percentage values from Excel are displayed correctly in Lucid without manually formatting each field?
Thank you very much for your support.
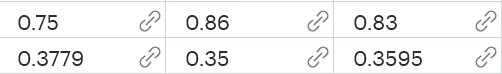
How it is displayed in Excel:
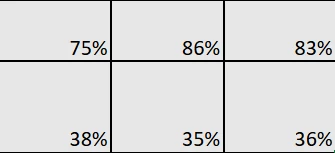
How it is displayed in Lucidchart: