Hello, I am new to Lucidchart and I have a few questions.
I have created an org chart using an org chart template and imported data from Excel. I tried to use the Data Link function but I don’t seem to have the “Two-way sync” button. Is this feature available in my version of Lucidchart?
Is it possible to add a different shaped box so that I can include a formula to sum up the different shapes?
Can you help with how to make bulk formatting changes to several boxes at once. For example, if I want all the Role Titles to be bolded, how do I do this in bulk, rather than one by one.
Is there a Conditional Formatting rule that can count the number of Direct Reports+Supervisor? For example, if the Supervisor has 3 direct reports, I want count to be 4 (instead of 3) to show the total number of FTE.
Best answer by Zuzia S
@CMnewuser thank you so much for your patience with our response!
1. After having a closer look into this, it seems like this experience is related to your account's configuration. As this involves private information, I recommend filing a ticket for this specific issue if needed.
2. Yes, there are multiple ways to have a separate shape that includes the sum of multiple shapes through a formula:
Sum all Downstream Deep: {{=sum(DOWNSTREAMDEEP)}}
Sum of contents of container: {{=SUM(#'C-v.vQ68G6Ws'.$contents)}}
Sum all shapes on page of specific shape type: {{=SUM(FILTER(DESCENDANTS(PAGE), SHAPETYPE = 'SparkIsoscelesTriangleBlock'))}}
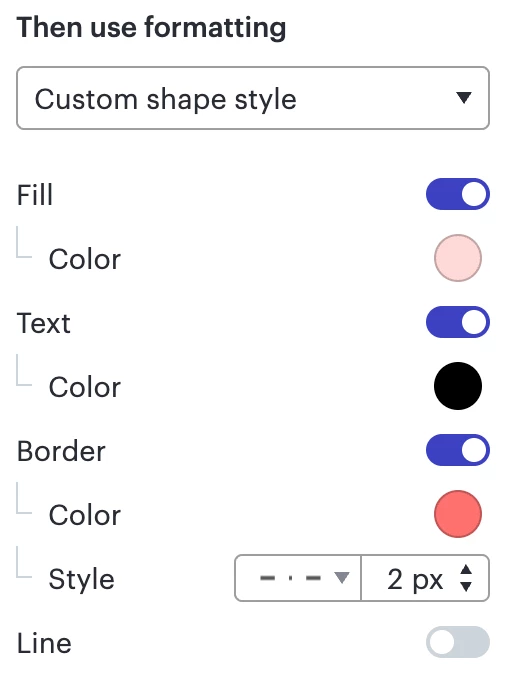
3. Unfortunately, when it comes to Conditional Formatting, only text color can be formatted, as such:
Therefore in order to change text’s style, such as making it bold, these changes have to be done manually. Please find more information on this topic in our Help Center article on Conditional Formatting. We’re very interested in your feedback and committed to continually improving our products. Please create an idea of your own and be sure to include details about your use case or what you’d like to see in this experience. This will also allow other users with similar requests to discover and upvote it, then add details of their own.
For more information about how we manage feedback in this community, please take a look at this post:
4. Yes, there is a way to include both the Supervisor and their Direct Reports in the count. The formula that will help you achieve this is =Count(DOWNSTREAMDEEP(graphnodes)) + 1
5. Regarding the layout style, it can only be applied to the entire Org Chart at the moment. If you would like to see tips on customizing your org chart, check out this community post. Please do not hesitate to submit this as an idea in the Product Feedback section in case it has not been submitted yet.
Let me know if you have any additional questions! Cheers!
@CMnewuser thank you so much for your patience with our response!
1. After having a closer look into this, it seems like this experience is related to your account's configuration. As this involves private information, I recommend filing a ticket for this specific issue if needed.
2. Yes, there are multiple ways to have a separate shape that includes the sum of multiple shapes through a formula:
Sum all Downstream Deep: {{=sum(DOWNSTREAMDEEP)}}
Sum of contents of container: {{=SUM(#'C-v.vQ68G6Ws'.$contents)}}
Sum all shapes on page of specific shape type: {{=SUM(FILTER(DESCENDANTS(PAGE), SHAPETYPE = 'SparkIsoscelesTriangleBlock'))}}
3. Unfortunately, when it comes to Conditional Formatting, only text color can be formatted, as such:
Therefore in order to change text’s style, such as making it bold, these changes have to be done manually. Please find more information on this topic in our Help Center article on Conditional Formatting. We’re very interested in your feedback and committed to continually improving our products. Please create an idea of your own and be sure to include details about your use case or what you’d like to see in this experience. This will also allow other users with similar requests to discover and upvote it, then add details of their own.
For more information about how we manage feedback in this community, please take a look at this post:
4. Yes, there is a way to include both the Supervisor and their Direct Reports in the count. The formula that will help you achieve this is =Count(DOWNSTREAMDEEP(graphnodes)) + 1
5. Regarding the layout style, it can only be applied to the entire Org Chart at the moment. If you would like to see tips on customizing your org chart, check out this community post. Please do not hesitate to submit this as an idea in the Product Feedback section in case it has not been submitted yet.
Let me know if you have any additional questions! Cheers!
Your Org Chart should have a dataset linked to it that is already stored externally. To clarify, are you wanting to collect a local file of the linked dataset in .xlsx format?
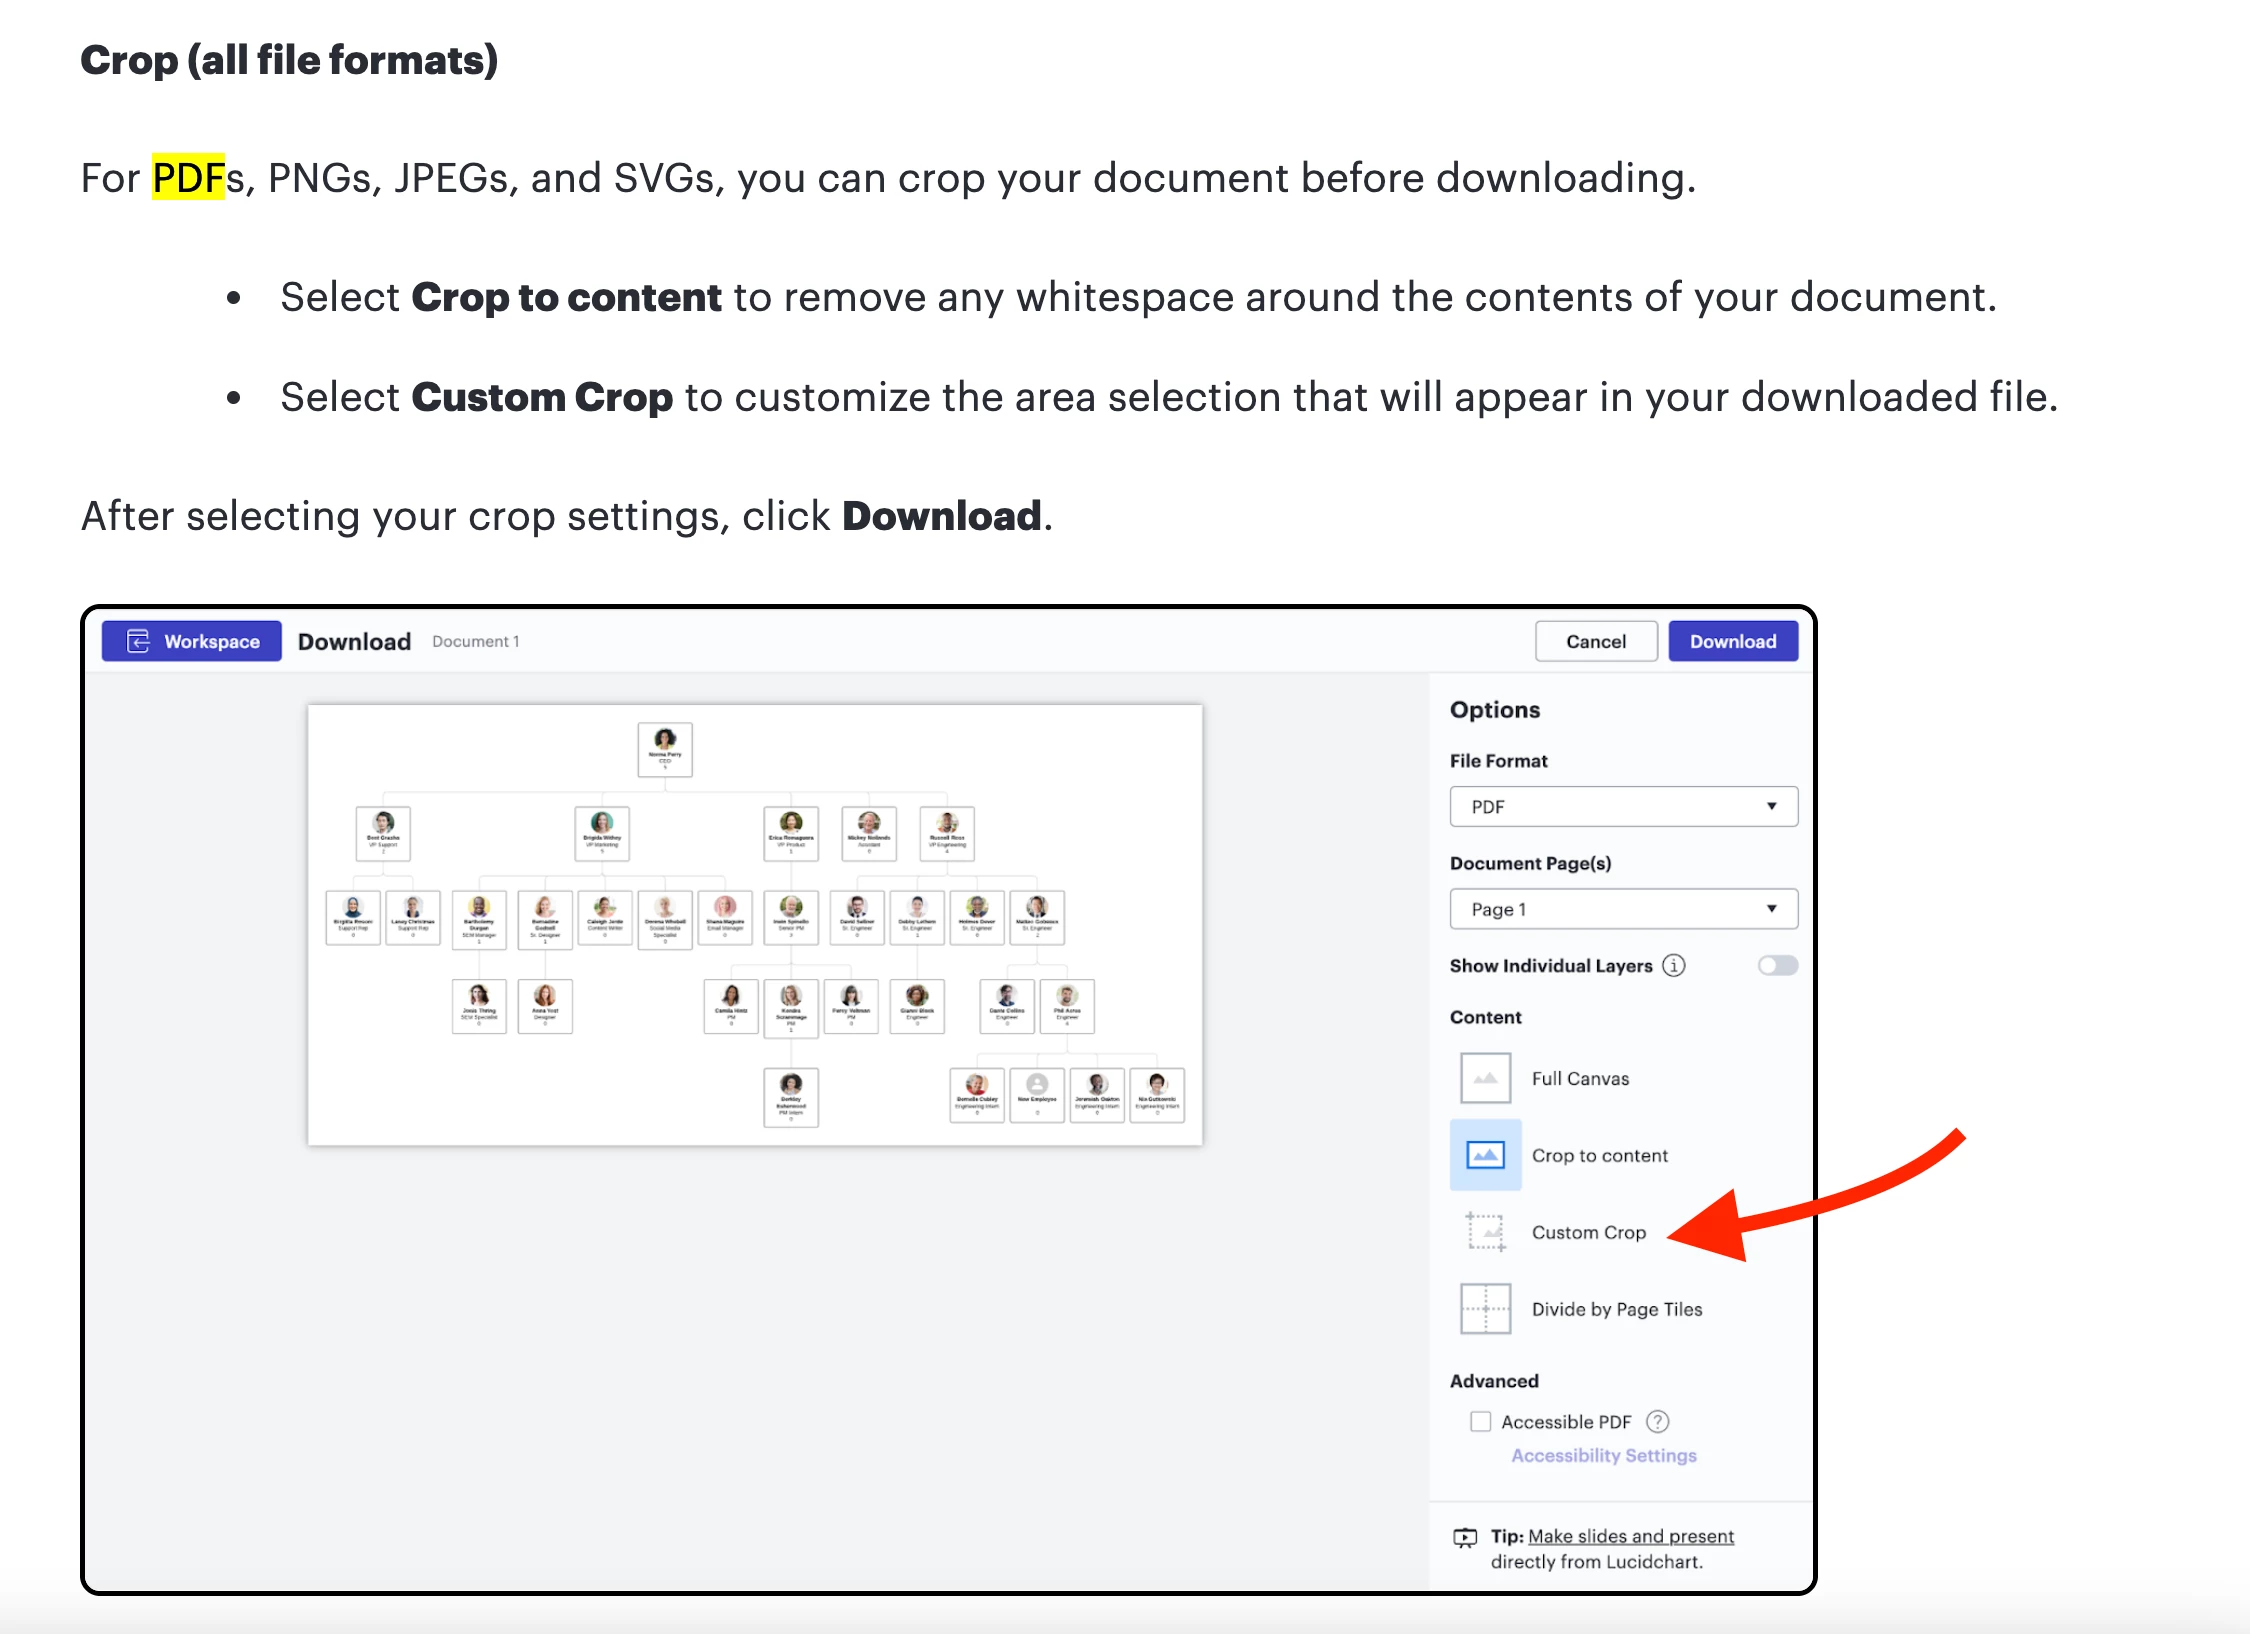
You may specify the contents of each PDF by using the “custom crop” feature when exporting the page.
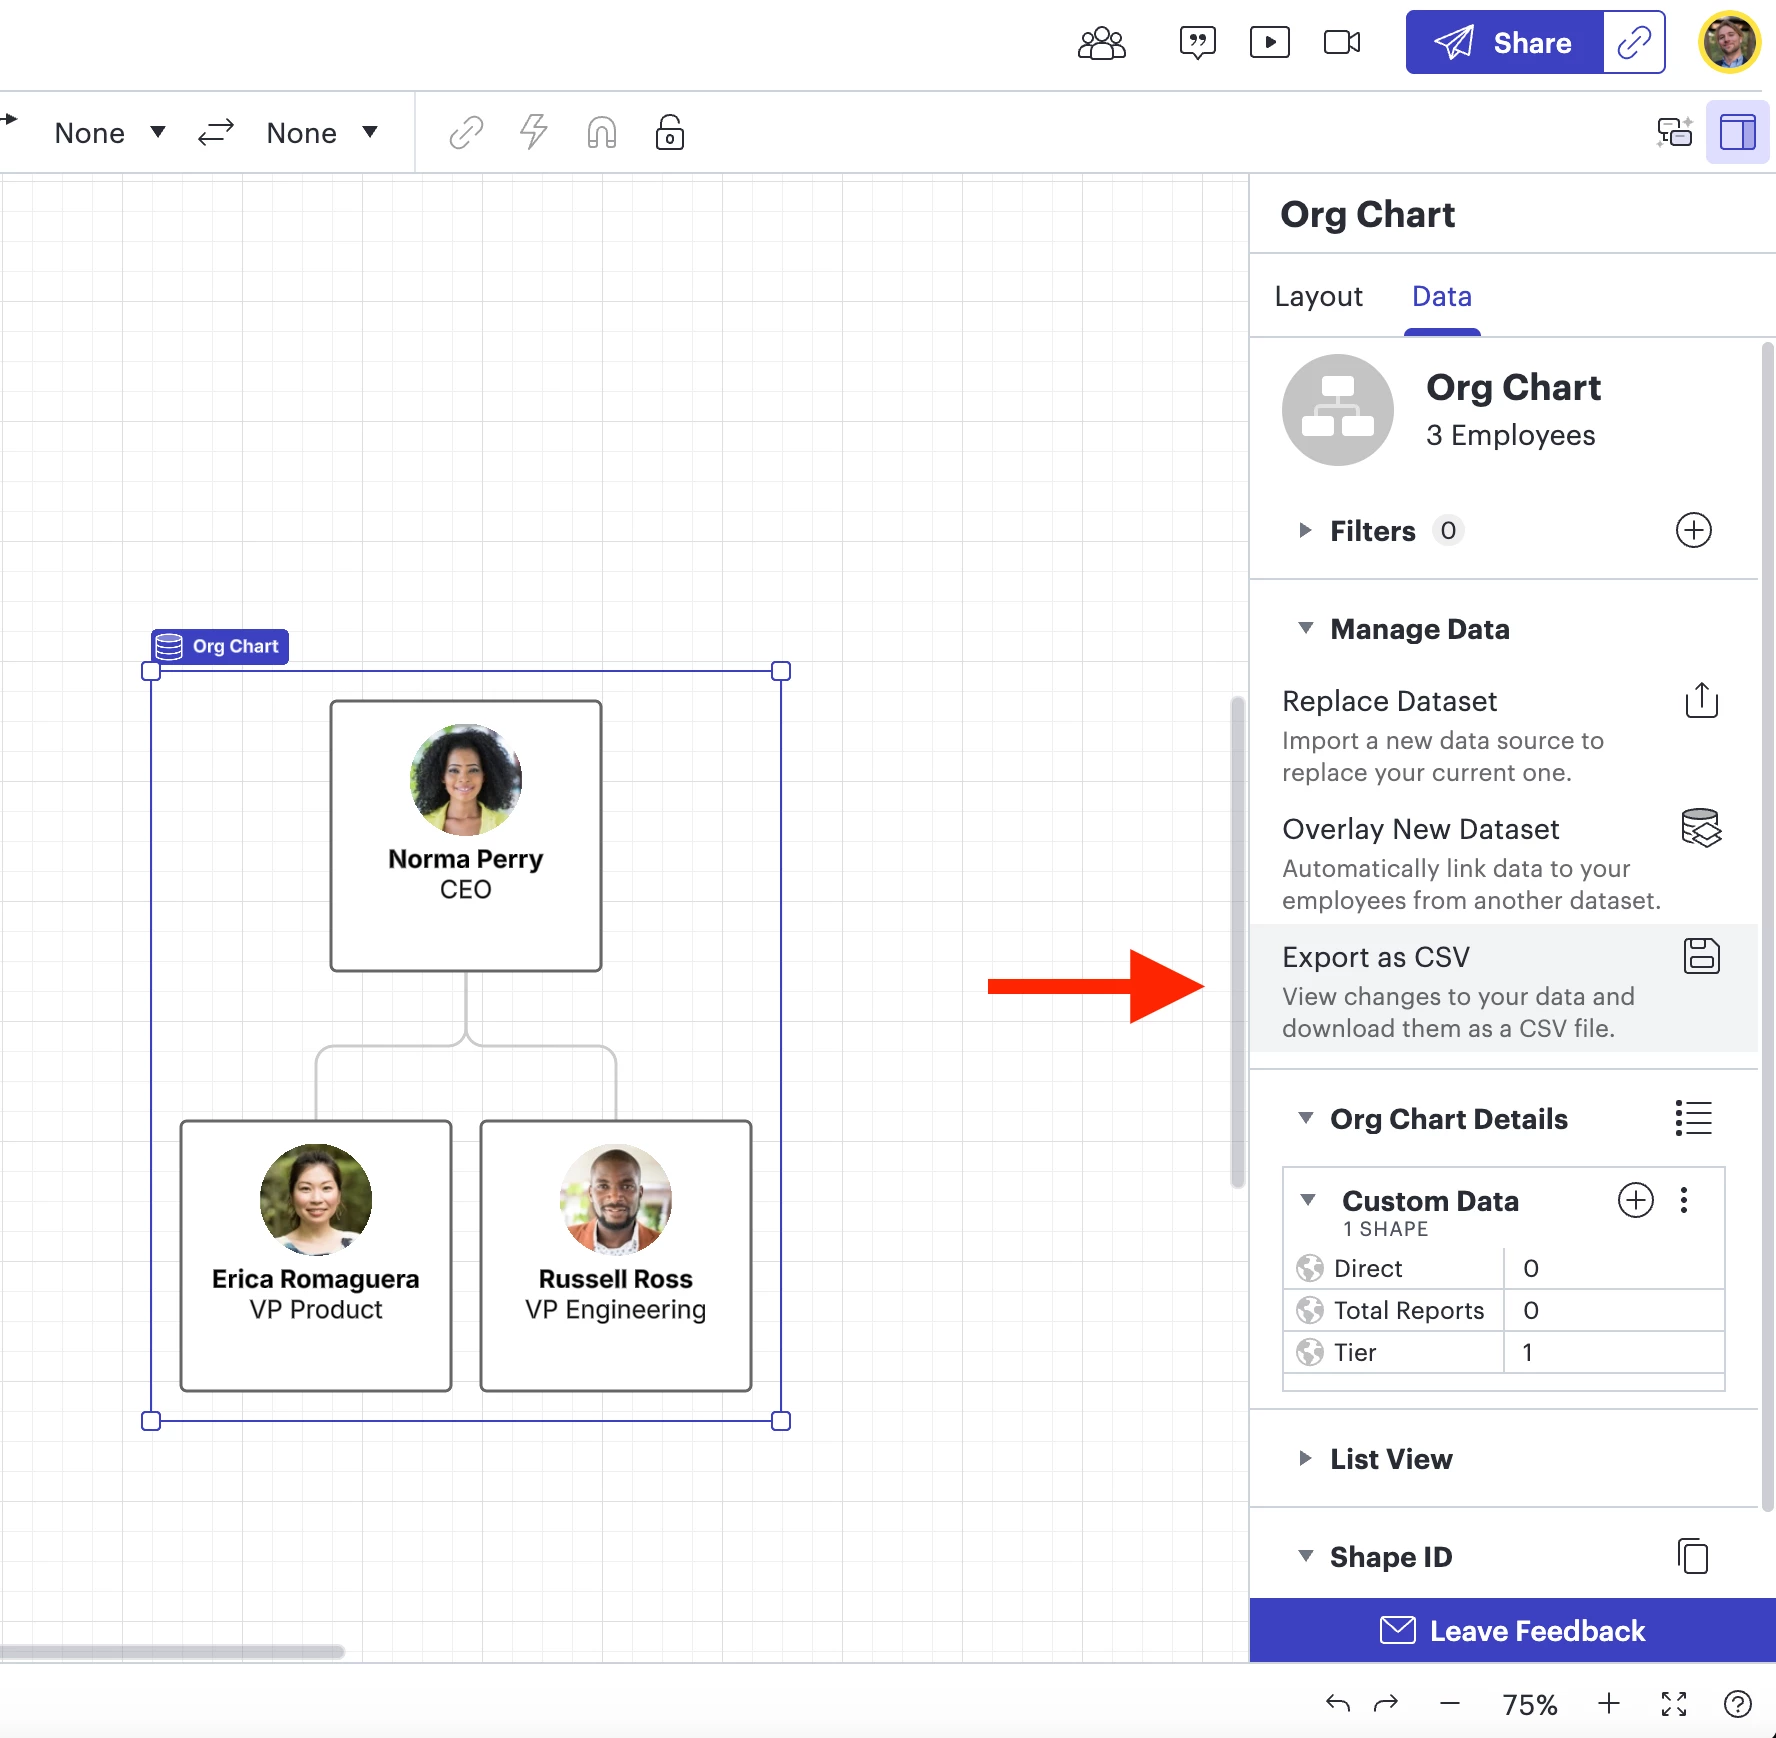
For # 1, as you’ve found, you can export the data associated with the Org Chart from the contextual panel on the right-hand side to CSV, though unfortunately .xlsx is not supported.
Org Chart > ‘Export as CSV’ option
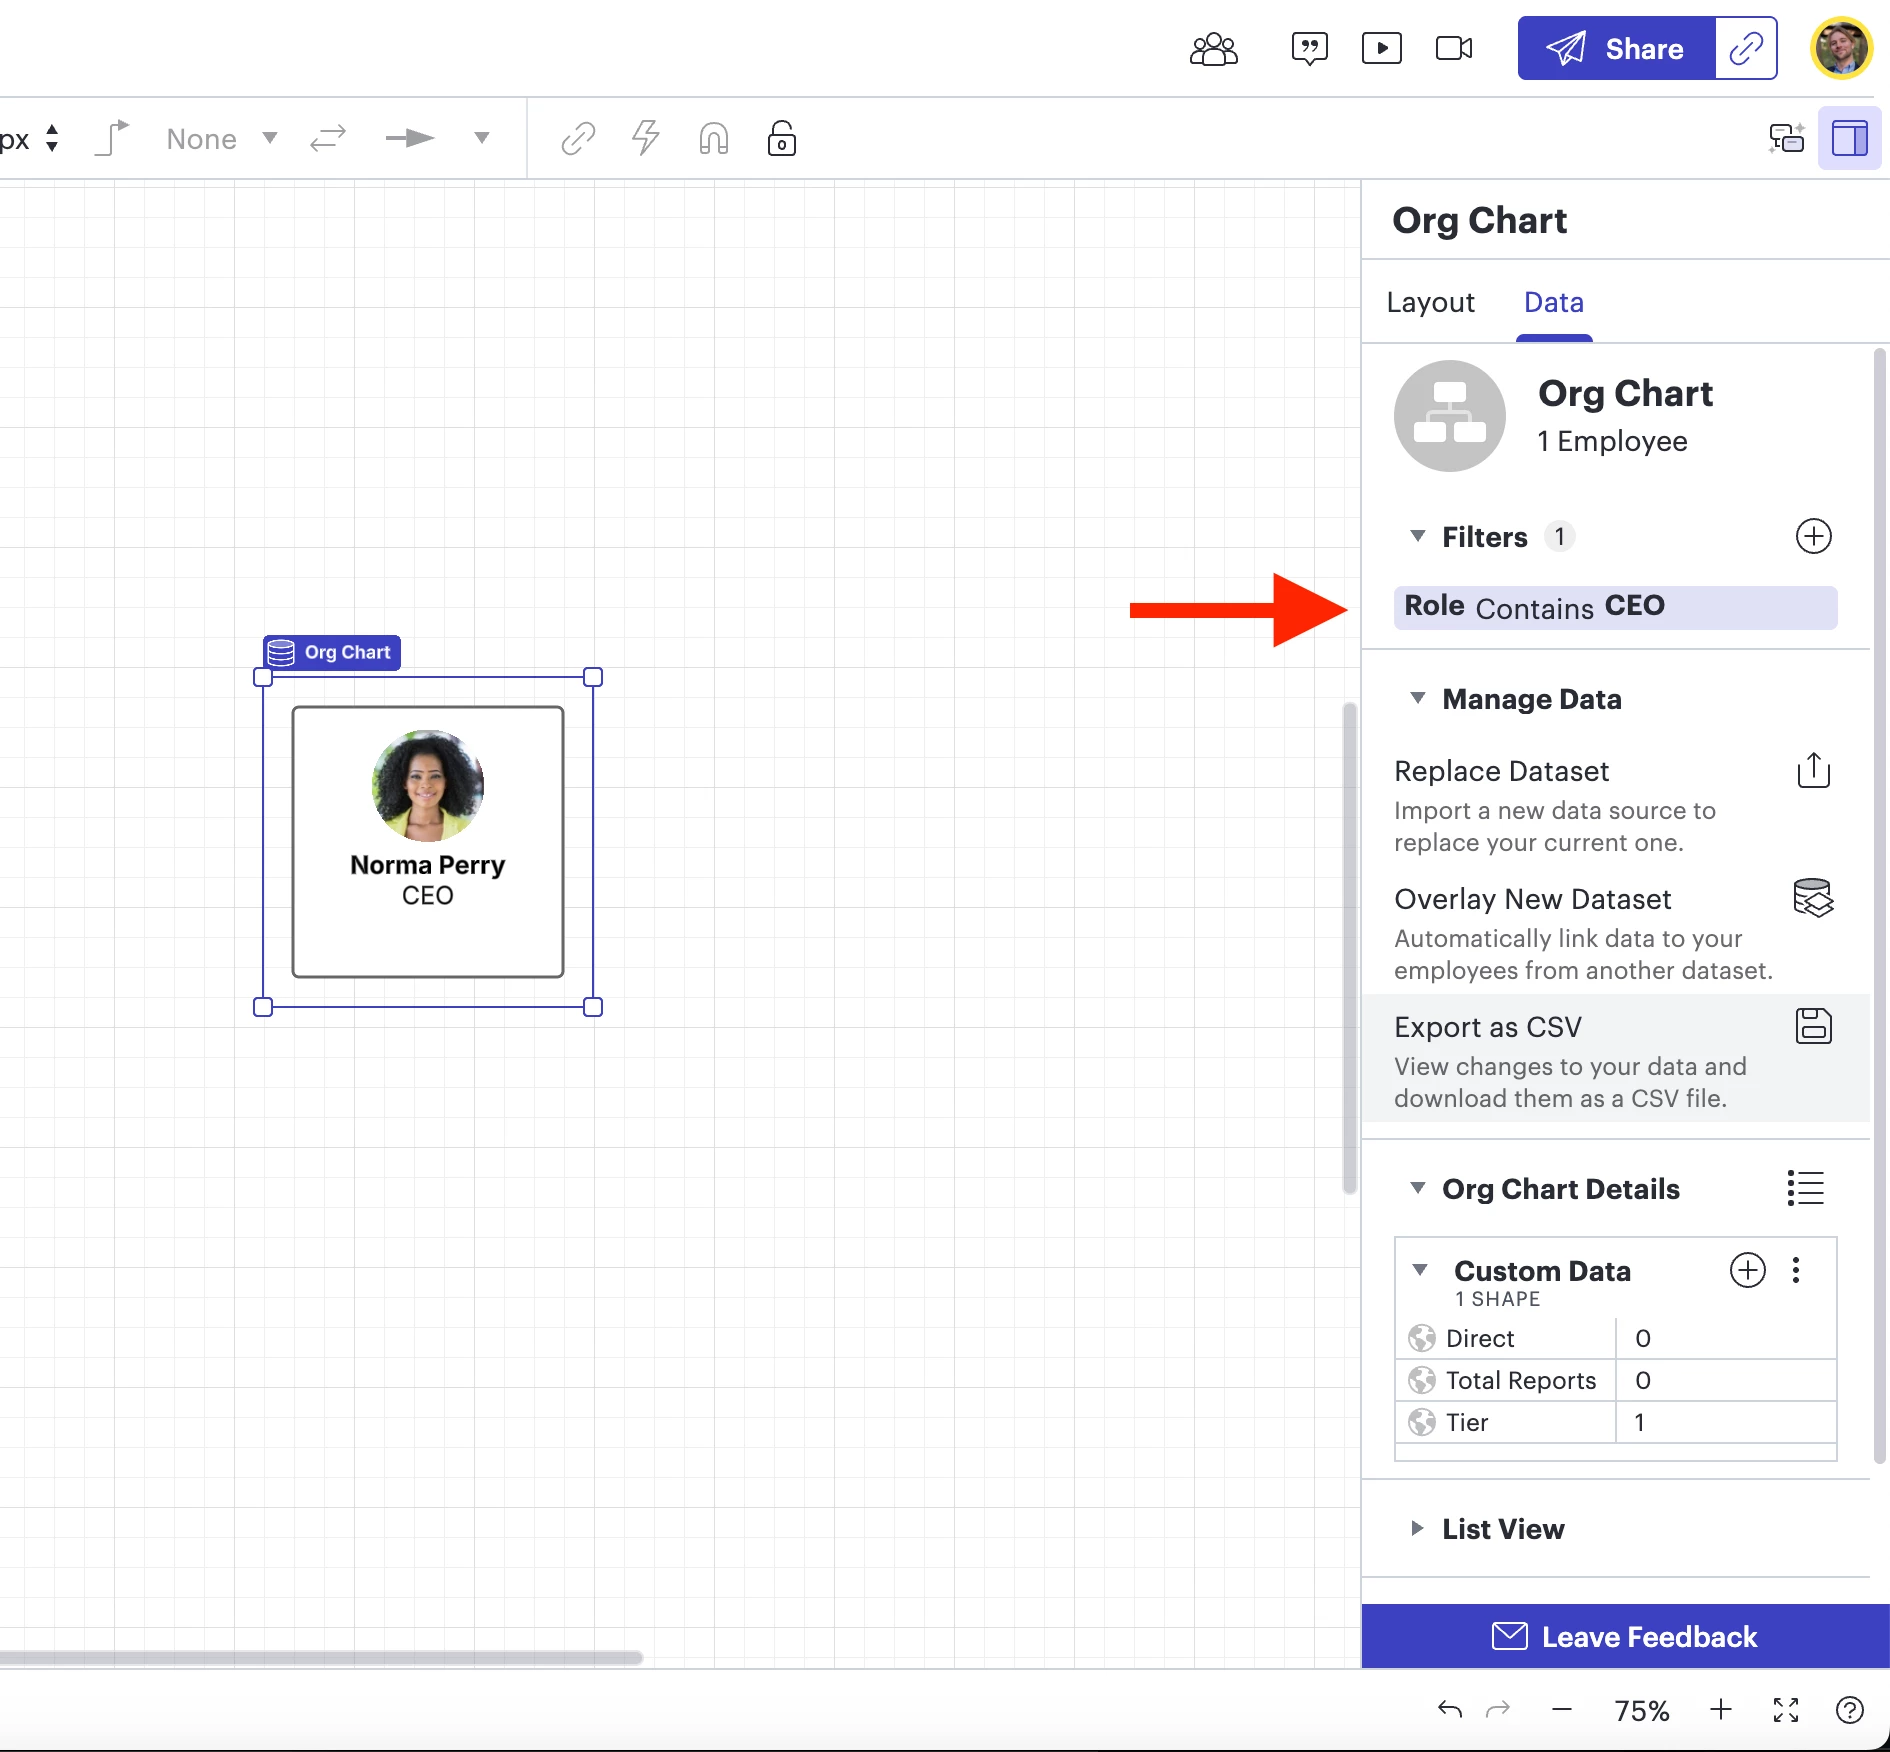
For #2, would a workable solution be for you to apply filters to your Org Chart before exporting the page?
A Lucid or airfocus account is required to interact with the Community, and your participation is subject to the
Supplemental Lucid Community Terms.
You may not participate in the Community if you are under 18. You will be redirected to the Lucid or airfocus app to log in.
A Lucid or airfocus account is required to interact with the Community, and your participation is subject to the
Supplemental Lucid Community Terms.
You may not participate in the Community if you are under 18. You will be redirected to the Lucid or airfocus app to log in.