
Announced during the Lately @ Lucid webinar on April 3rd, the Cloud Accelerator is now live and available for purchase by Enterprise-level accounts! For more information, check out the Cloud Accelerator overview help center article. In this post, we’ll be going over some use case examples.
Engineering teams know all too well just how quickly their cloud environment changes, and how difficult it can be to keep cloud architecture diagrams in sync. Continually updating these diagrams can feel overwhelming, and maintaining these at scale is often a slow process that lags behind constantly-evolving cloud environments.
Too much time is spent verifying the accuracy of architecture diagrams, and since they often don’t reflect real-time changes to the cloud environment, key decisions are often delayed. Even worse, making decisions on inaccurate data can lead to costly rework.
These difficulties are often heightened by the fact that cloud visualization tools aren’t flexible enough to adapt to a variety of workflows and integrate with existing processes. The rigidness and lack of details offered in cloud diagramming tools make it challenging for teams to effectively manage their tasks.
That’s where the Cloud Accelerator comes in- helping your organization understand and plan future changes to cloud infrastructure. The Cloud Accelerator aids in the creation of accurate, customizable cloud documentation and diagrams. The process is streamlined with automatic generation, reusable components, and modifiable visuals.
So how exactly does it work? Let’s take a look at some of the features available in the Cloud Accelerator that can be leveraged by engineering teams!
Note: Current Lucidscale customers now have access to some of these features - including AWS org import, manual layout, and unmapped resources!
An engineering team would like to create an artifact that helps stakeholders understand the current system, so they need to start by importing their cloud data.
Within the Cloud Accelerator in Lucid, they open the data hub where they’ll import new AWS data. They have the option to connect to individual AWS accounts, or connect to an entire AWS organization. Instead of importing AWS accounts one by one, the engineering team decides to connect to an entire AWS organization.
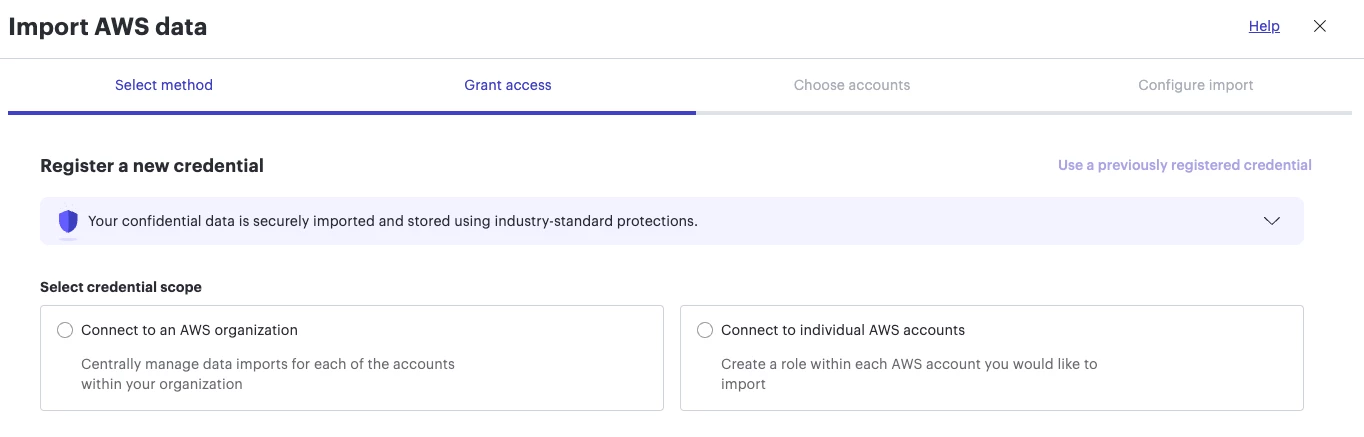
Selecting this option loads all AWS accounts, but they can choose to deselect any resources they don’t desire to import. The team selects import data, and can move on to other work while everything is getting imported.
Once the entire AWS organization is imported, they come back to the data hub and share the cloud data with other teams. These teams can see and use the data to immediately create their own models and views without the need for another import.
The data hub provides all engineering teams with a unified set of data for modeling and planning, without the need for reimporting data. Importing entire cloud footprints from Azure or Google Cloud is also supported.
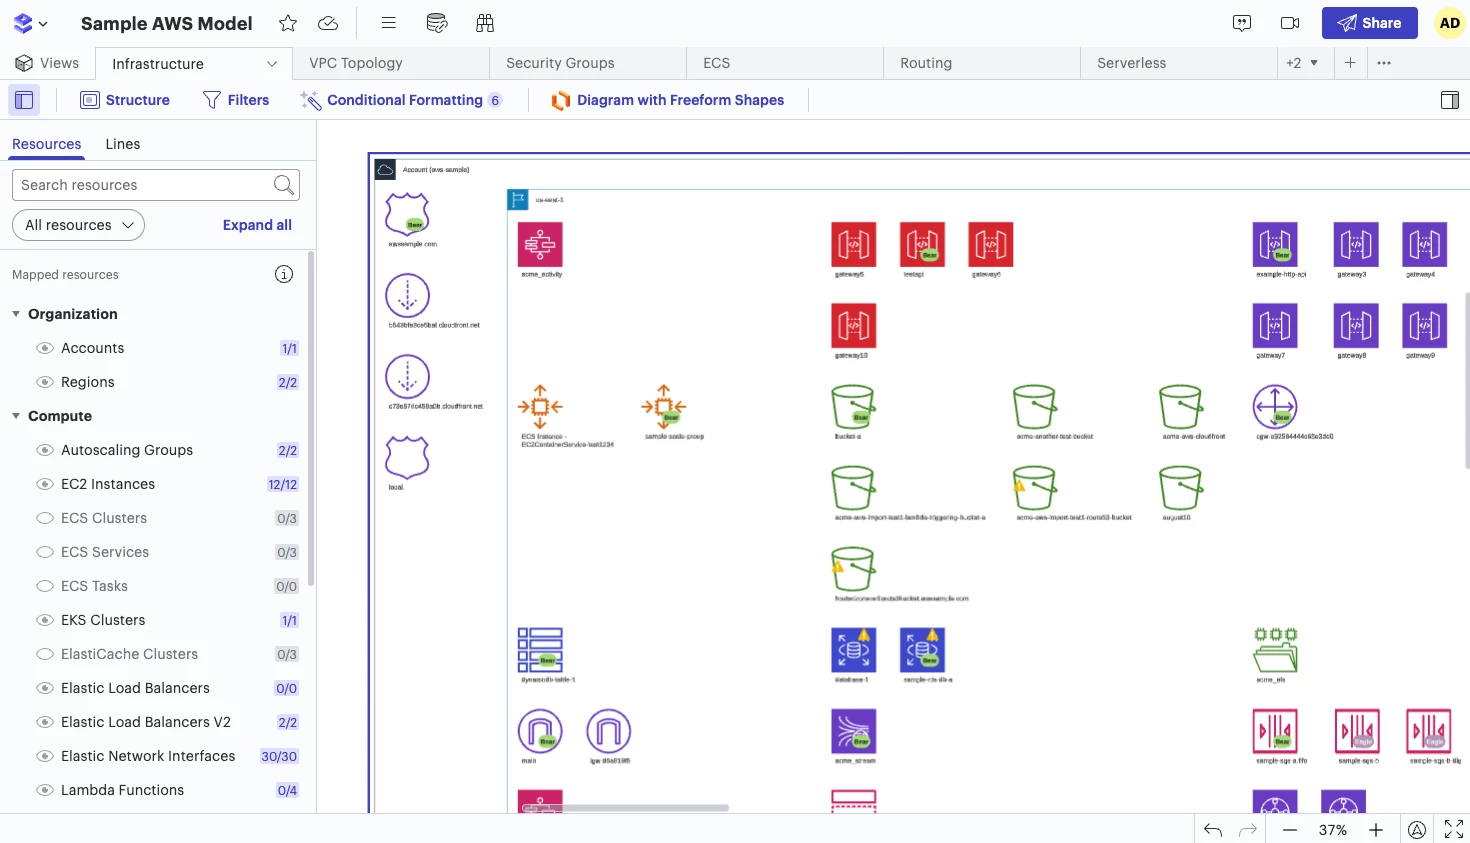
Now that the team’s cloud data is imported, they can create a new model to visualize their cloud infrastructure.
Manual Layout
With a new model created, they’re ready to edit the diagram and make more sense of their cloud architecture.
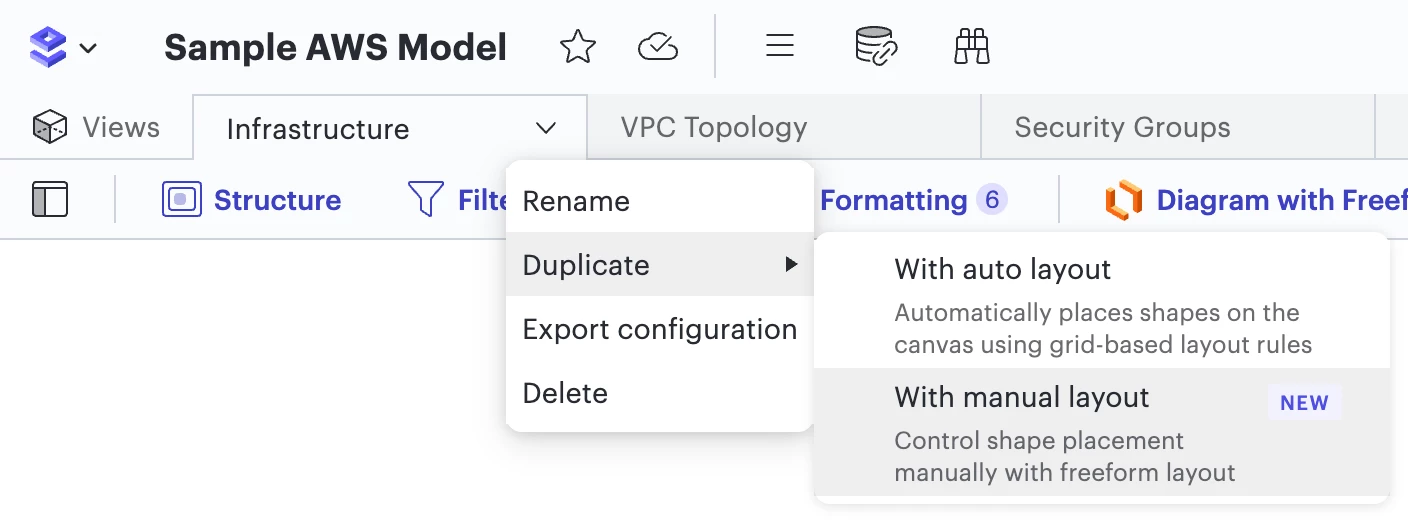
The engineering team selects the new manual layout feature. Manual layout allows teams to control shape placement and freely move components, making it easier to visualize the cloud infrastructure in a way that fits their needs.
The team can choose to create a manual layout from scratch or by duplicating an existing view, which allows for additional customization while keeping the existing view intact. With manual layout, they have total control over shape placement and container sizing, and can easily make changes to the model.
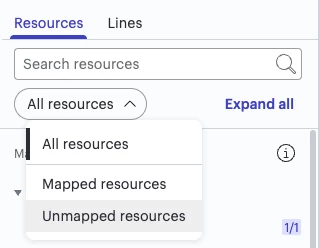
They can also easily view and drag unmapped resources onto the canvas for a more complete picture of the infrastructure. Note that unmapped resources are the ones that are unable to be placed in the correct area during the import process.
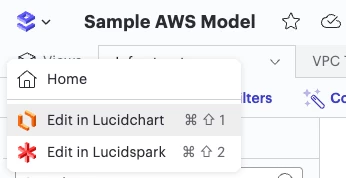
Switch into Lucidchart
After mapping out current state architecture and making needed adjustments, the team of engineers wants to brainstorm future possibilities. Directly within the same model, they can switch to edit in a Lucidchart document.
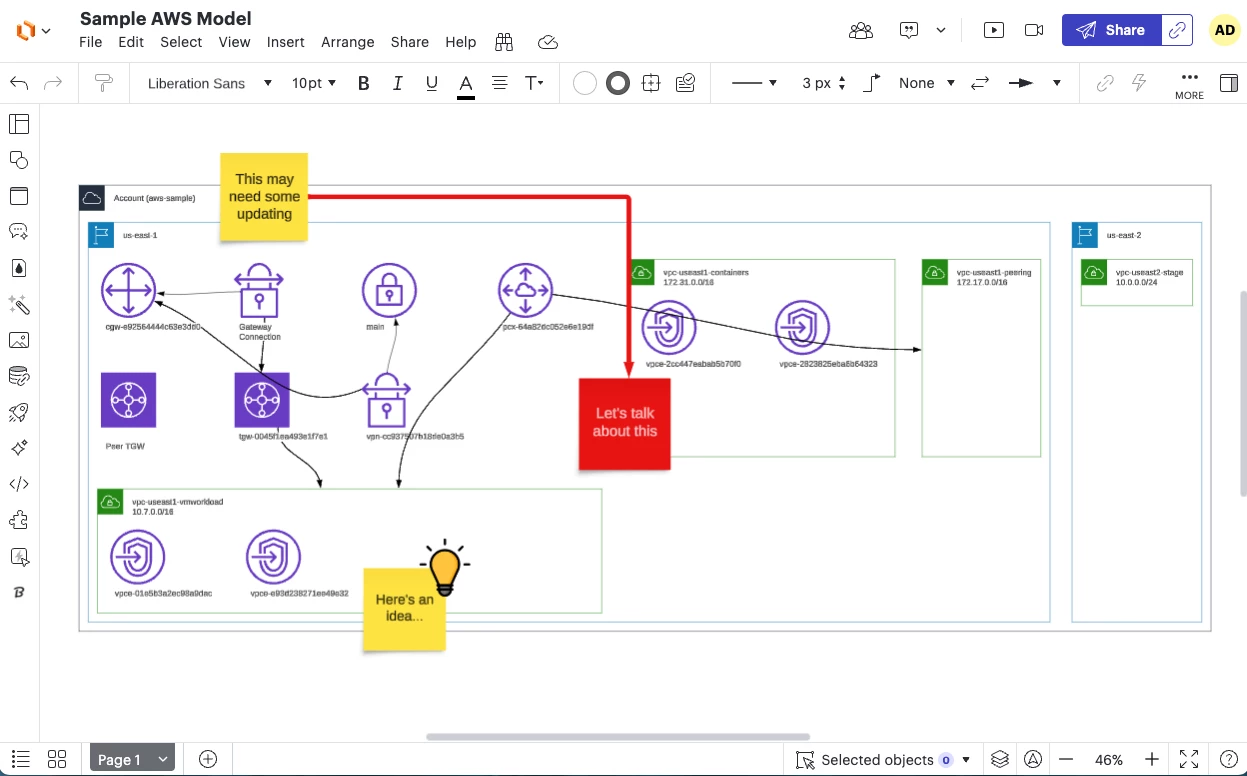
After switching into Lucidchart, they add sticky notes to brainstorm. They can add annotations and other shapes to their original model to make more sense of what is happening in the system.
Still in Lucidchart, the team creates a dependency diagram to map out the future state and dependencies, all on the same page as the original model for reference.
Note: To add a Lucidchart diagram next to a Lucidscale model, you must start in Lucidscale first and then use universal canvas to switch into editing in Lucidchart.
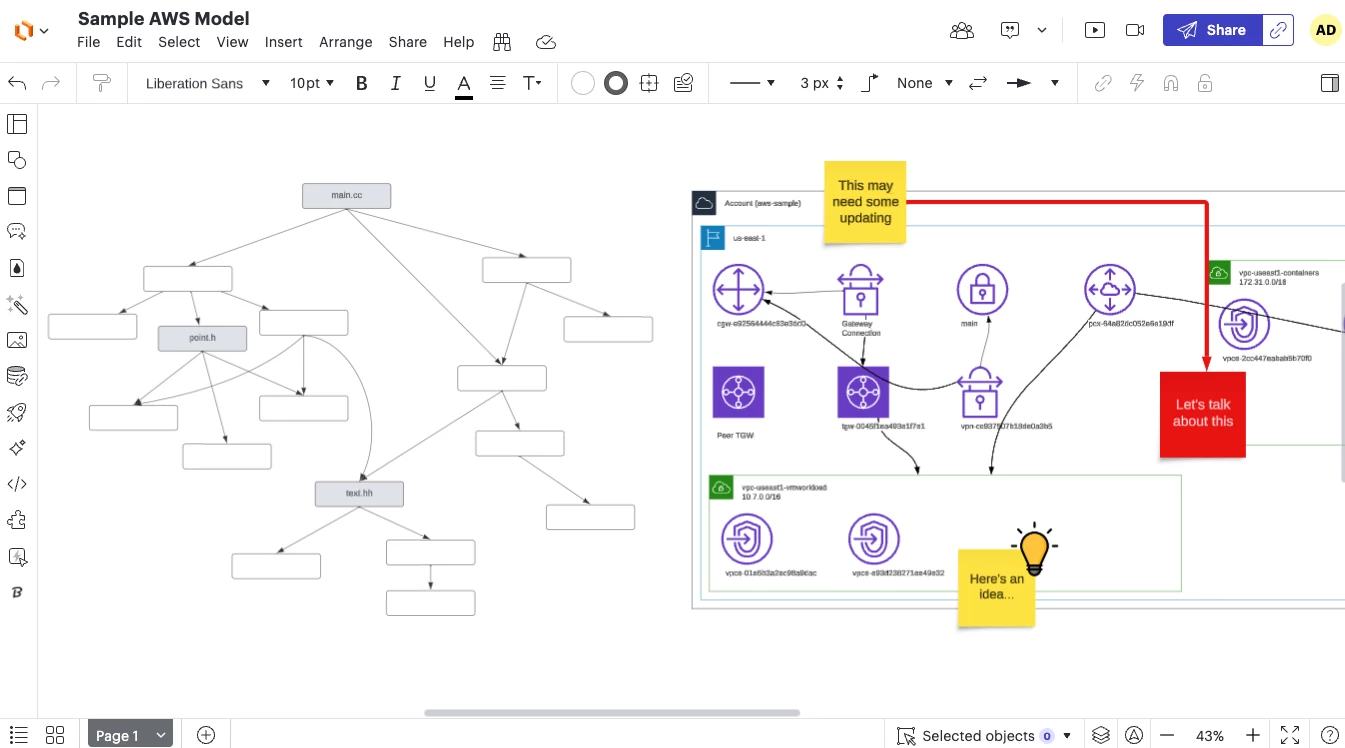
If they’d like to pull in more data, they can now drag imported cloud data directly into Lucidchart, creating an additional model on the same canvas. As the cloud environment changes, the engineers can refresh the data and the models stay in sync.
The ability to move between Lucidscale and Lucidchart on the same canvas helps teams to quickly work between cloud visualizations, future state diagramming, and brainstorming.
That’s a wrap on the Cloud Accelerator!
The Cloud Accelerator helps organizations understand and plan future changes to cloud infrastructure. With this accelerator, you can create accurate, customizable cloud documentation and diagrams.
For more information, check out this article from the Lucid Help Center: Cloud Accelerator overview
Is this the first you’re hearing of the Cloud Accelerator and didn’t make it to the Lately @ Lucid event? See what you missed!
Questions? Search the Lucid Help Center, drop a comment below, or post your question in the community!
