Create a timeline and gantt chart to organize Azure DevOps cards
Hello,
Let me first start thanking you for responding back to my queries. I am currently working on an important project for my organization and need to create a Timeline and Gantt chart for my project. This gantt chart should show:
Azure DevOps items by % completion. I want to use hardcoded numbers for now based on state. (I am using LucidSpark cards for DevOps).
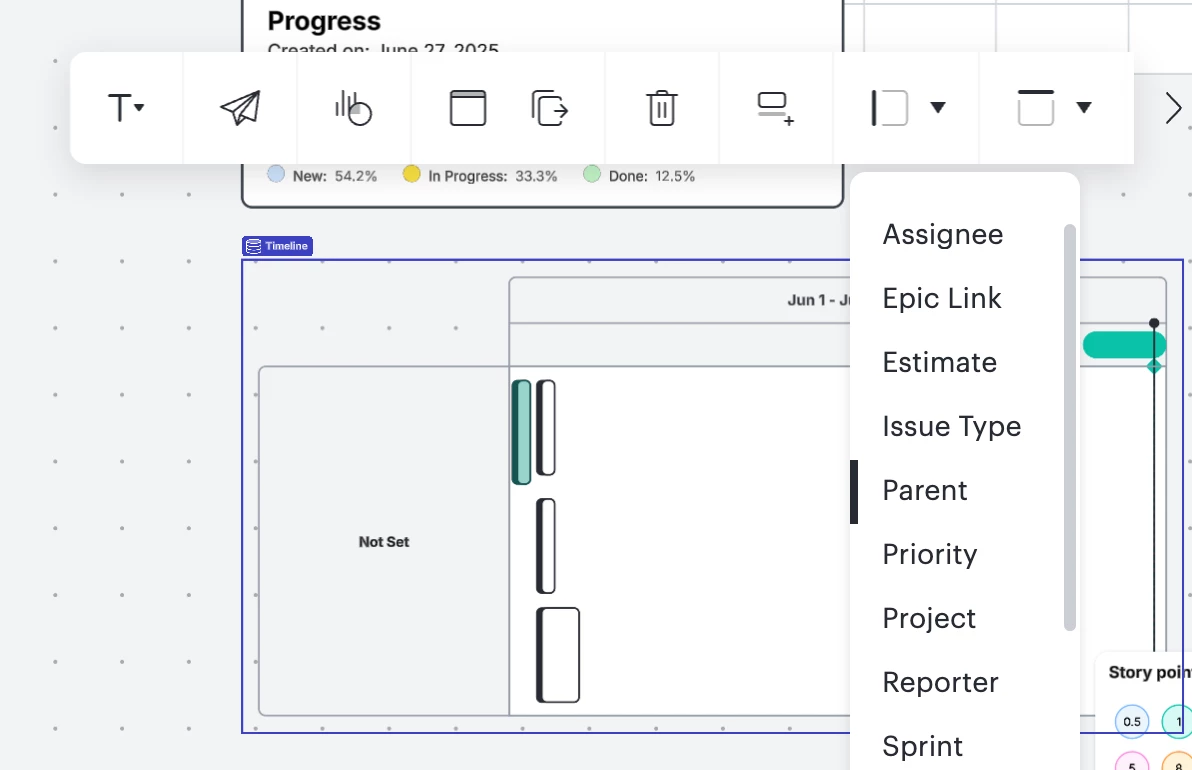
I want to use different option instead of custom row while filter/reorg option
In below snapshot, I want to show milestone by specific dates but need it dynamically for each item.
Also progress bar should show % completed within the card.
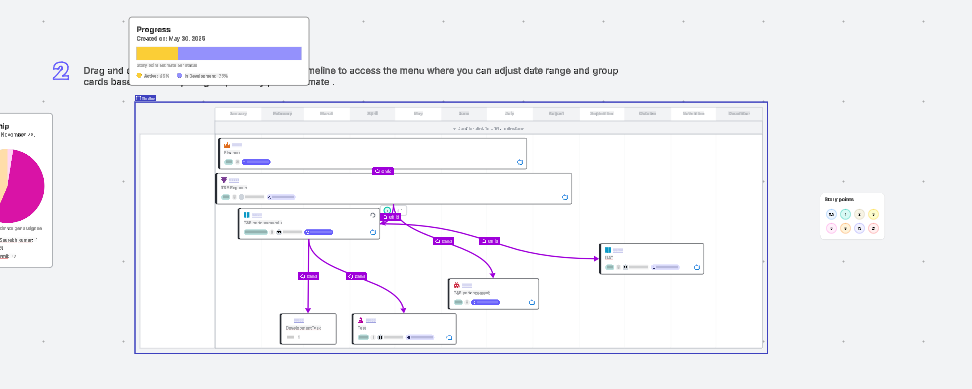
My aim is to add “progress bar” with % completion of each card (aka work item) and Milestone with a reference date. For example, I have data for each of the work item when it moved to In development state which I want to show.
Looking forward to hearing from you.
Page 1 / 1
Hi @SharmilShah,
Thank you for your post, currently progress bars are not customizable in what data it is being tracked. It will only track the progress of the cards in the timeline. Do you mind clarifying what you mean by filtering by custom row? Do you mean changing the row and column headers? Do you also mind clarifying what you mean by showing a milestone dynamically? Currently, you can only show a milestone by adding it to the timeline but it remains static.
Row and Column Filters
Hi @Kelsey Gaag ,
Thanks for replying back. Here are the answers:
Do you mind clarifying what you mean by filtering by custom row? Do you mean changing the row and column headers? : Sharmil: I have custom fields in my ADO board. I would like to filter it by those rows and columns.
Do you also mind clarifying what you mean by showing a milestone dynamically? Currently, you can only show a milestone by adding it to the timeline but it remains static. Sharmil: For milestone, I am looking for each of the card/row should show when a work item moved to in development and in UAT etc. I have those dates available but not sure how to link it automatically.
I didn’t get your point “currently progress bars are not customizable in what data it is being tracked. It will only track the progress of the cards in the timeline”. Do you mean that from ADO Cards, it will still fetch the timeline with progress%? OR it is just the timeline without the progress %.
Hi @SharmilShah,
Thank you for the reply! Unfortunately neither of these functionality are possible in Lucid, in a timeline, you can only filter by the provided row options, or select custom row and designate the row manually.
As for the milestones, these are manual features that don’t have an option to be automated based on the dates in the cards.
I’ve converted this post to an idea so that it’s visible to others within the Product Feedback section of the community - from here, they can upvote it and add details of their own.
For more information on how Lucid manages feedback via this community, take a look at this post:
A Lucid account is required to interact with the Community, and your participation is subject to the
Supplemental Lucid Community Terms.
You may not participate in the Community if you are under age 18. You will be redirected to the Lucid app to log in.
A Lucid account is required to interact with the Community, and your participation is subject to the
Supplemental Lucid Community Terms.
You may not participate in the Community if you are under age 18. You will be redirected to the Lucid app to log in.