Current smart containers only allow 1 grouping the grouping becomes the container (box) and shapes are rendered into it. Can we have another level like box in a box meaning 2 level of grouping before shapes are rendered.

Hi Thomas


Thanks for posting in the community. We're always looking for ways to improve! Would you mind adding your suggestion to our feature request form? Requests submitted via this form are passed directly to our product development team for their consideration. 


Also as a note container shapes (under the flowchart shape libraries) unlike smart containers do allow for this. Depending on how you are using smart containers this may be a usable work-around.


Also as a note container shapes (under the flowchart shape libraries) unlike smart containers do allow for this. Depending on how you are using smart containers this may be a usable work-around.

Thomas, Could you point me to any article on how to use these “container shapes” with imported data. I’m interested in trying this solution. 


Hi @Jshood, thank you for continuing this post!

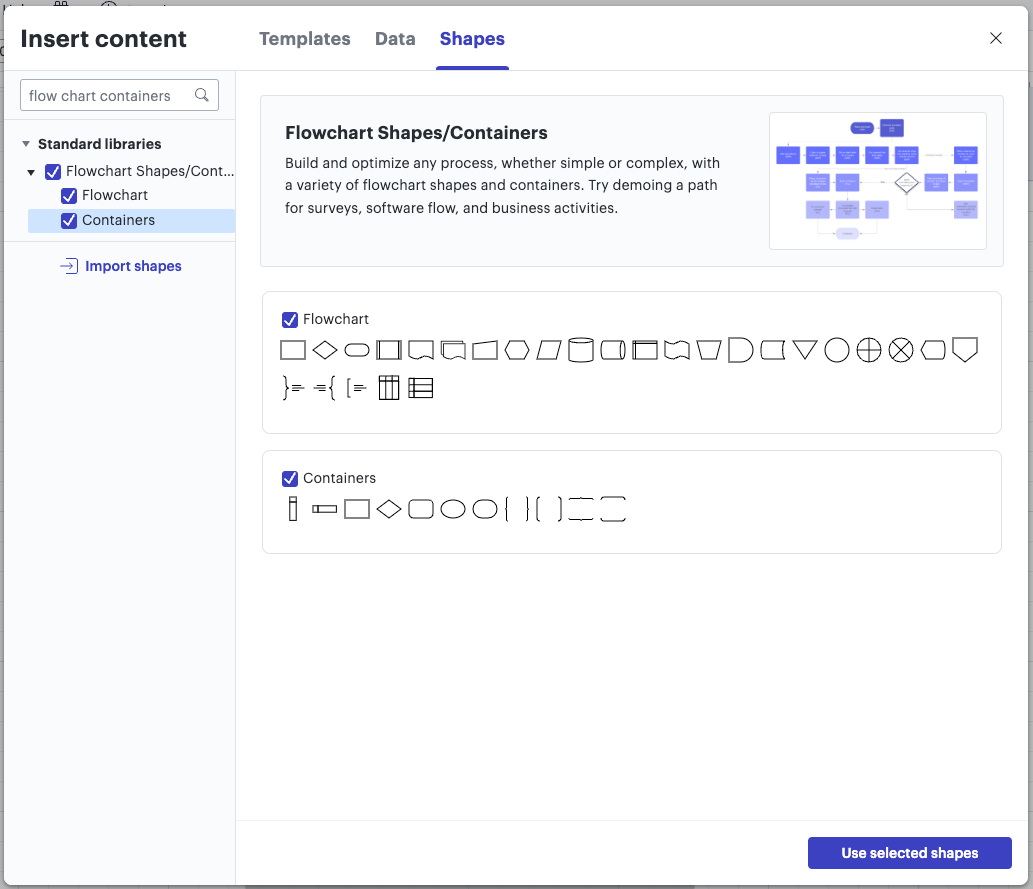
The container shapes mentioned in Tate’s reply above can be found in the shape library under ‘Flowchart Shapes/Containers’. You can enable this shape library by clicking the blue ‘More Shapes’ button and searching for ‘Flow chart containers’.

To use this library, make sure you check the box next to ‘Containers’ and click the blue ‘Use selected shapes’ button to confirm. 

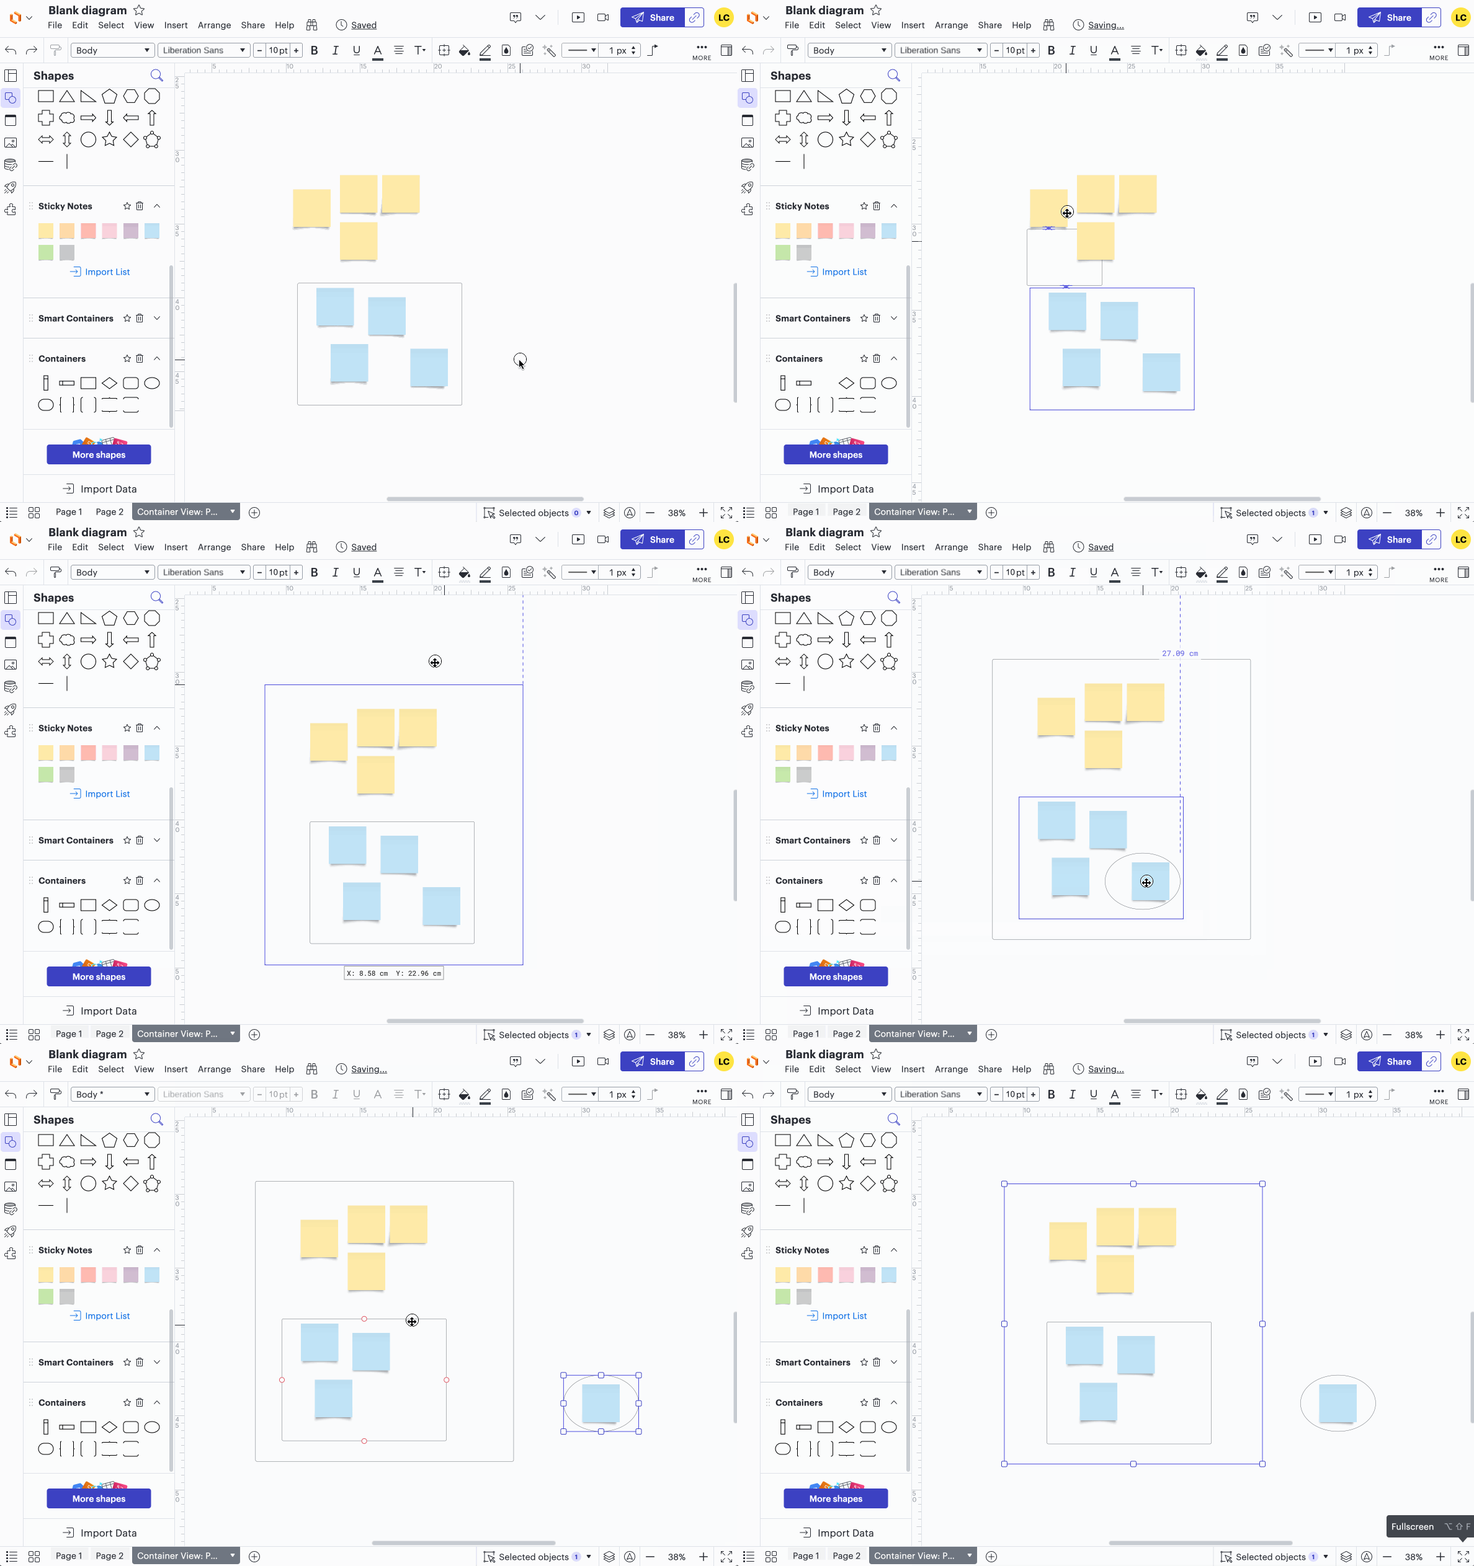
Unlike smart containers, the containers in that library allow you to have layers of containers to group your objects and they can each be moved individually. See the GIF below for a quick demonstration! 


If you have access to the feature, you could pair this with data-linked objects to visualise your imported data. 

I hope this helps! Feel free to let us know if you have any additional questions :) 


Hi, Is there any way to do a 2nd grouping within a smart container without manually using the data linking feature mentioned above? I am happy with the data showing in my smart container, but would like to group it by a second layer. Alternatively can I convert it to a flow chart container?


I would also like to see support for additional levels. Perhaps structured like an Org Chart


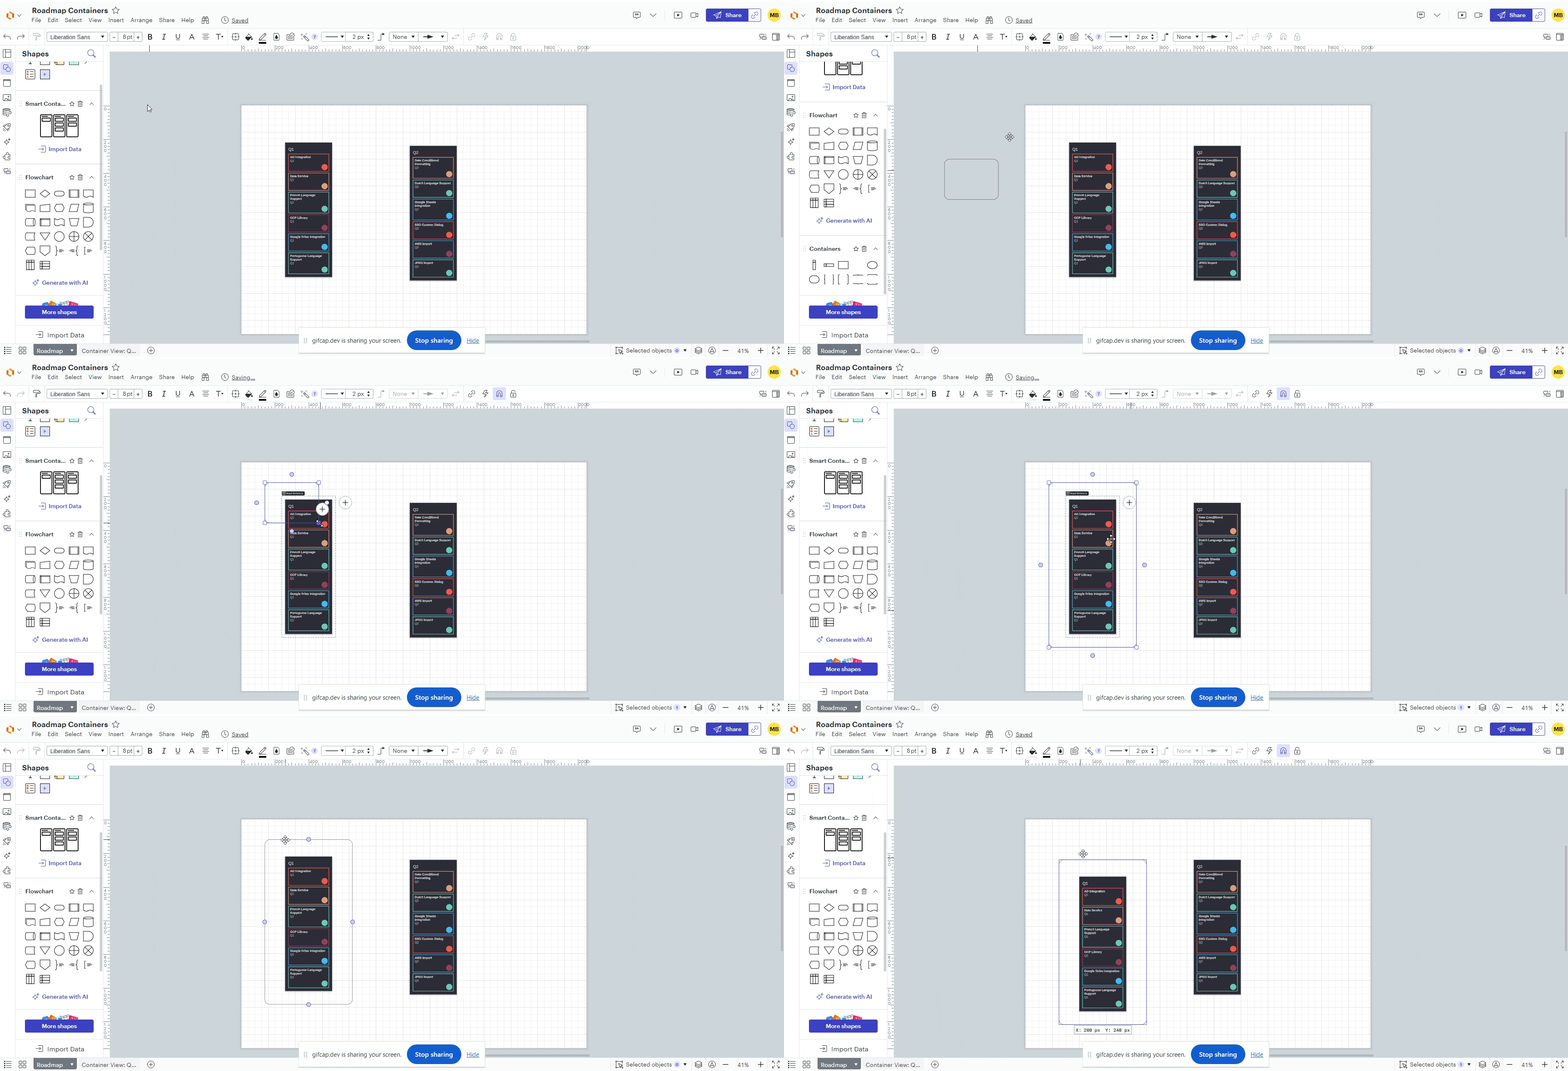
 Hi @John Satta and @lynleyg, thanks for continuing this thread.  We’re very interested in your feedback and committed to continually improving our products. I’ve provided additional information about sharing your feedback below, but first first, I’d like to share a workaround that might accomplish what you’re interested in without data linking. You can duplicate your smart containers, then delete all but one of the containers to give you individual  containers that move independently. In my example below, I’ve copied smart containers that detail a product roadmap separated by quarters, then removed all but the Q1 container from the first object and all but the Q2 container from the second object. 


Then, you can add a container object to serve as this second layer of grouping (and add as many of the individual smart containers as you want/need to it):


Regarding any feedback you have on this experience, please first search the Product Feedback section of this community (with the filter Topic Type = Idea) to see if it’s already been submitted. If so, please add any additional details you’d like and upvote the request - this consolidation helps to refine feedback and properly capture the popularity of the request.

If no one has submitted this idea yet, please create one of your own and be sure to include details about your use case or what you’d like to see in this experience. This will also allow other users with similar requests to discover and upvote it, then add details of their own.

Finally, for more information on how Lucid manages feedback via this community, take a look at this post:


Thankyou so much! great workaround :)


I’m glad that helped! Keep the questions and feedback coming 😄


Also as a note container shapes (under the flowchart shape libraries) unlike smart containers do allow for this. Depending on how you are using smart containers this may be a usable work-around.

Thomas, Could you point me to any article on how to use these “container shapes” with imported data. I’m interested in trying this solution. 

Visualize data with Smart Containers – Lucid Best feature in Lucidchart, aside from Live integrations with Jira/AzureDevOps or other data link auto-digramming.


 Hi @John Satta and @lynleyg, thanks for continuing this thread.  We’re very interested in your feedback and committed to continually improving our products. I’ve provided additional information about sharing your feedback below, but first first, I’d like to share a workaround that might accomplish what you’re interested in without data linking. You can duplicate your smart containers, then delete all but one of the containers to give you individual  containers that move independently. In my example below, I’ve copied smart containers that detail a product roadmap separated by quarters, then removed all but the Q1 container from the first object and all but the Q2 container from the second object. 


Then, you can add a container object to serve as this second layer of grouping (and add as many of the individual smart containers as you want/need to it):


Regarding any feedback you have on this experience, please first search the Product Feedback section of this community (with the filter Topic Type = Idea) to see if it’s already been submitted. If so, please add any additional details you’d like and upvote the request - this consolidation helps to refine feedback and properly capture the popularity of the request.

If no one has submitted this idea yet, please create one of your own and be sure to include details about your use case or what you’d like to see in this experience. This will also allow other users with similar requests to discover and upvote it, then add details of their own.

Finally, for more information on how Lucid manages feedback via this community, take a look at this post:


Thanks for trying to solve but the workaround isn’t helping. It only seems to allows for additional single level groupings. I’ll raise a feature request for a 3 level smart container, as opposed to 2.

Think of this as hierarchical groupings informed by data linking. I have 3 level data but the 3rd level is not used for grouping and can only be a data attribute of the 2nd level. Not good enough for my use case.


Hey @Thomas Stumpp -- thank you so much for posting and for this great feedback! We always appreciate when our users take the time to let us know how we can improve. 

Firm handshake to you and all of the dedicated Lucid users on this thread! 🤝


Please help upvote the feature request for 3 level smart containers.

Smart Container with 3 levels | Community (lucid.co)


Reply