
Hi


So I'm trying to use Lucidchart for Venn diagrams with applications in categorical logic. 


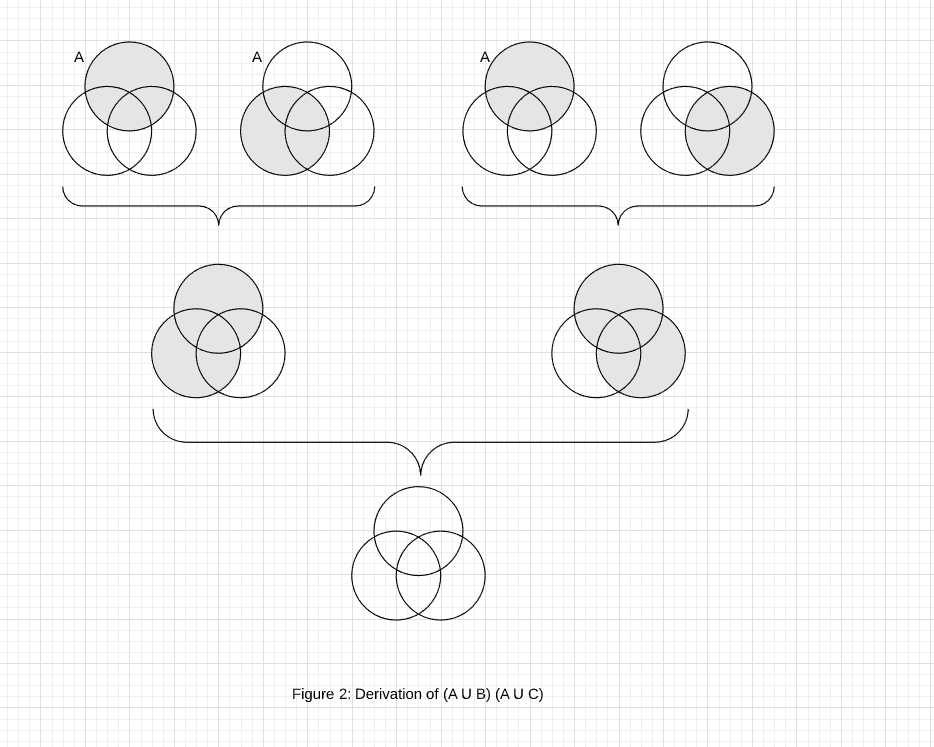
So if we start with three partially overlapping circles labeled A B and C in the standard triangular arrangement we have four regions in the middle of the diagram where the circles overlap. Each overlapping area depicts the intersection of the different sets A B and C represented by the circles. See: (document URL removed for privacy and security)


In the bottom Venn in that document what needs to be shaded in is the ellipse in the bottom center of the three circles representing the intersection of the bottom two circles B and C. How does one select _just that area_ for shading? And similarly with any of the other four regions where the circles overlap?


Also does anyone know how to get other character sets for text in Lucidchart? I need mathematical symbols like an upside-down "U" for "intersection."


Thanks kindly in advance


David

Hi David

Thanks for posting in the community and thanks for the detailed description and example.

Your document URL has been removed for security and privacy reasons however for anyone else reading this here is David's illustration:

Pc6bDh4vvi_9ubR4qoVV4w.png

There is no streamline way to shade shape intersections however a work around would be to use a flex-polygon shape behind the circles.

WxFEq5U7Lr4OiIQmhgxdOQ.gif

It's far from ideal but may work depending on your use.

For other character sets Lucidchart doesn't have a UI for uncommon characters. However you can use ALT codes to access them. For example to get you hold down your ALT key and type 239. For more useful ALT codes check out this resource.

If you would like to see a more streamlined implementation for shape section shading or special characters could you post in our Product Feedback section? Our developers use these submissions to track feature demand and help structure their work accordingly. 


Hi Kent


Thanks very much for taking the time to give such a detailed and informative reply to my question. It was very helpful! Your workaround of using a flex polygon works just fine for my needs. I've finished that diagram and will soon be moving on to the next! 


One other question as you seem to be designated as being able to give "official comments." I am an academic. I am hoping to use the image files I create in Lucidchart in published scholarly research work. At the moment this would be articles in academic journals--for which authors receive no royalties or other payments or fees. But it might later include a book for which authors typically do receive nominal royalties. 


Anyway I wanted to verify my understanding of clause 5.1 of Lucidchart's "Terms of Service." As I read this downloaded image files of the documents I create using Lucidchart qualify as my "User Content."  As such those are among the things to which I "own all right title and interest." Is that right?


I will gladly credit Lucidchart as the software used to create my diagrams and images thereof I just want to be sure that I won't be infringing on any copyright intellectual property or other claim of Lucidchart in my publishing those (images of) those diagrams.


Thanks again


David 


Hi David


Thanks for the question! Lucid is supportive of the use of our software in your materials.

We ask that you do the following:


  • Reference/cite any product screenshots.

  • When you cite us please use “Created in Lucidchart www.lucidchart.com” or other wording that references both our full brand name and our website.

  • Use the recently-updated version of our logo (can be found linked from our website).


Let me know if you have any further questions.


Reply