I'm interested in making a radar graph with 5 lines radiating from the center like a star. I would like to graph a score on each of the 5 radial lines from 1-10 and then connect them with a line. This will help show areas of greatest weakness in a company. Any tips on how to make the 5 lines radiating from the center and mark them with numbers from 1-10? Any help would be greatly appreciated.
Solved
Radar or Spider Graph in Lucidchart
Best answer by Micah
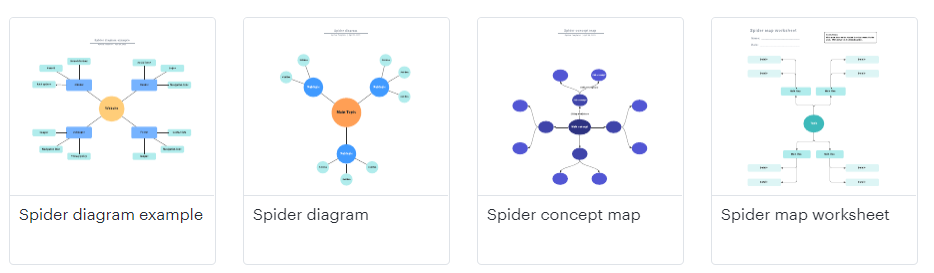
@enrique l Thanks for continuing this thread! While we currently don't have a radar template in our library we would love to see your request in our Product Feedback section so that our team is better able to understand how this would be useful to you and your work. Additionally while these might not be an exact match for what you're looking for perhaps some of our spider templates could serve as a foundation for your diagram which you could then further customize.
For more information please take a look at this article from the Lucid Help Center and post any additional questions below!

Create an account in the community
A Lucid or airfocus account is required to interact with the Community, and your participation is subject to the Supplemental Lucid Community Terms. You may not participate in the Community if you are under 18. You will be redirected to the Lucid or airfocus app to log in.
Log in to the community
A Lucid or airfocus account is required to interact with the Community, and your participation is subject to the Supplemental Lucid Community Terms. You may not participate in the Community if you are under 18. You will be redirected to the Lucid or airfocus app to log in.
Log in with Lucid Log in with airfocus
or
Enter your E-mail address. We'll send you an e-mail with instructions to reset your password.