Hello Jason
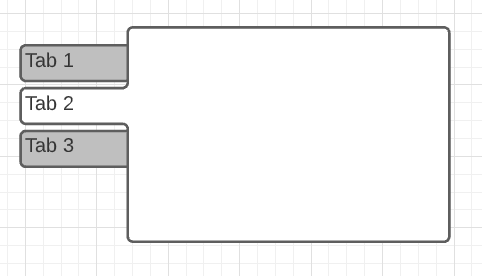
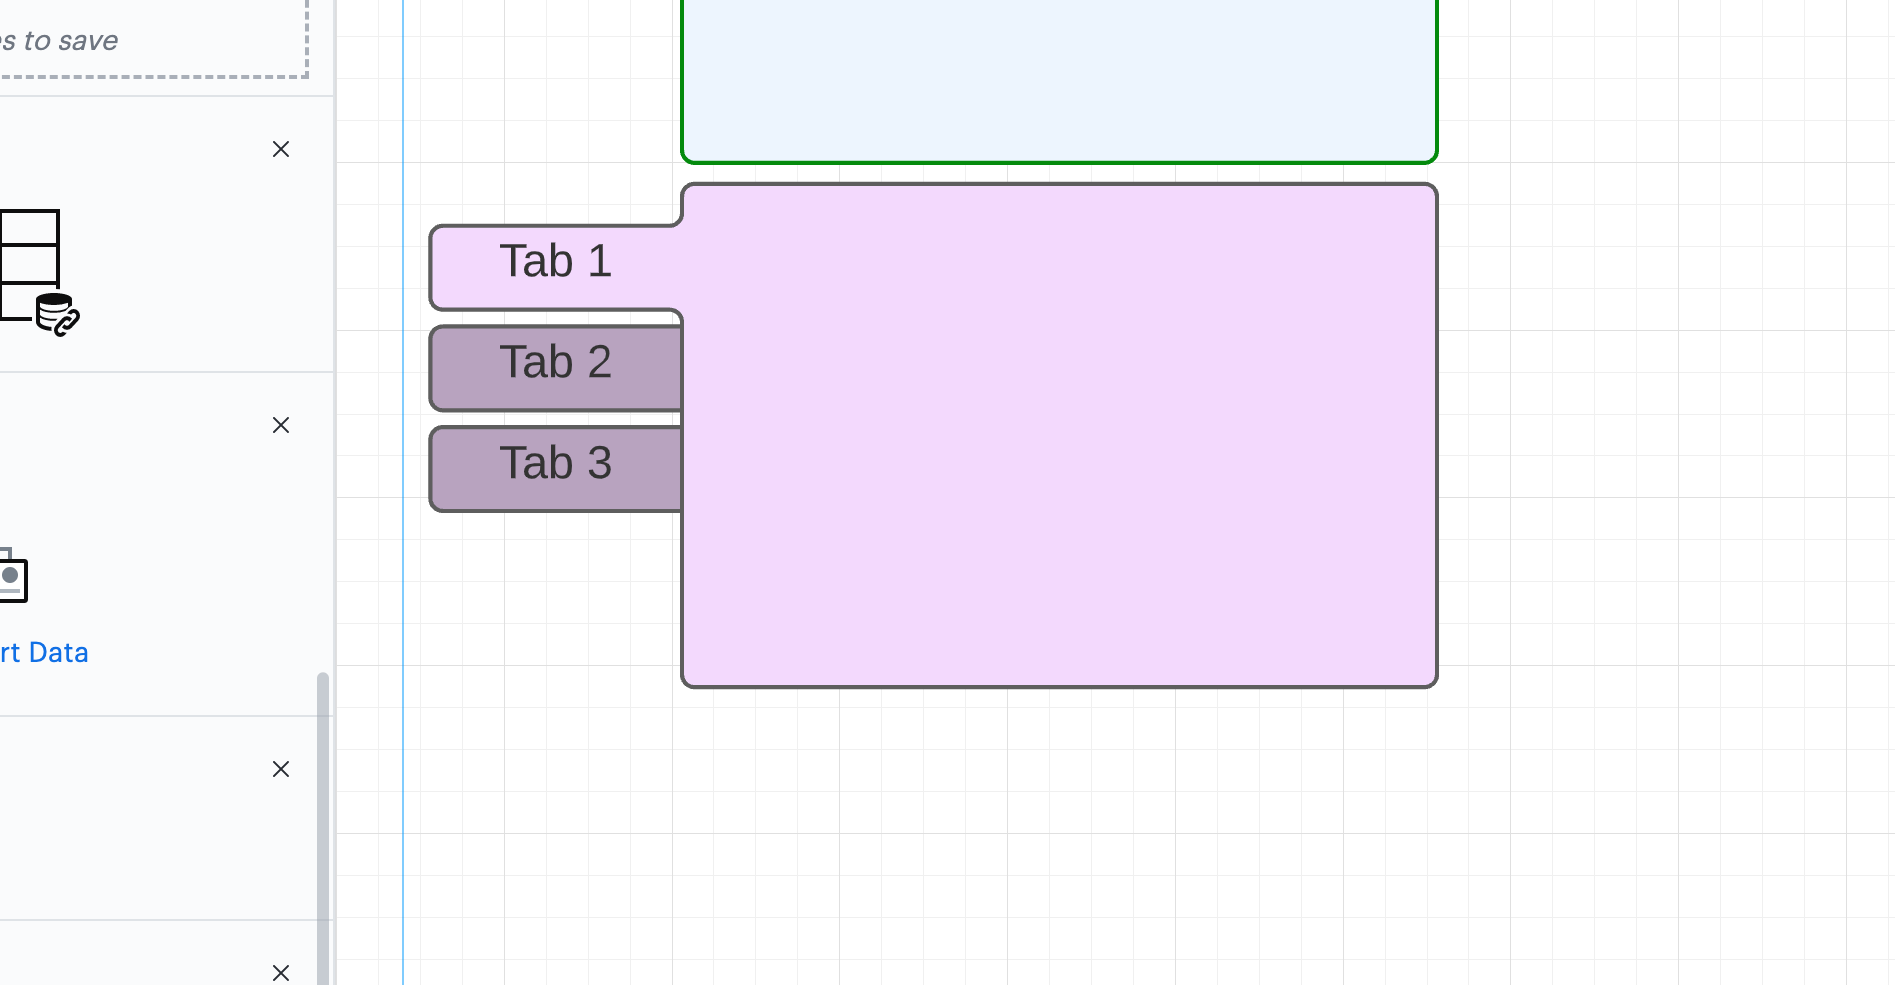
Thanks for posting in the Lucid Community! Once a UI container is placed on your chart you won't be able to change its fill color. However that doesn't mean you can't have a variety of colors for your UI shapes. Keep in mind that you cannot change the colors per tab only per object/container. So if you decide to have that shape above be red every other tab will also be red just a darker shade (like it is when it's white). Before you place a UI container on your chart change the color fill setting in the panel at the top. 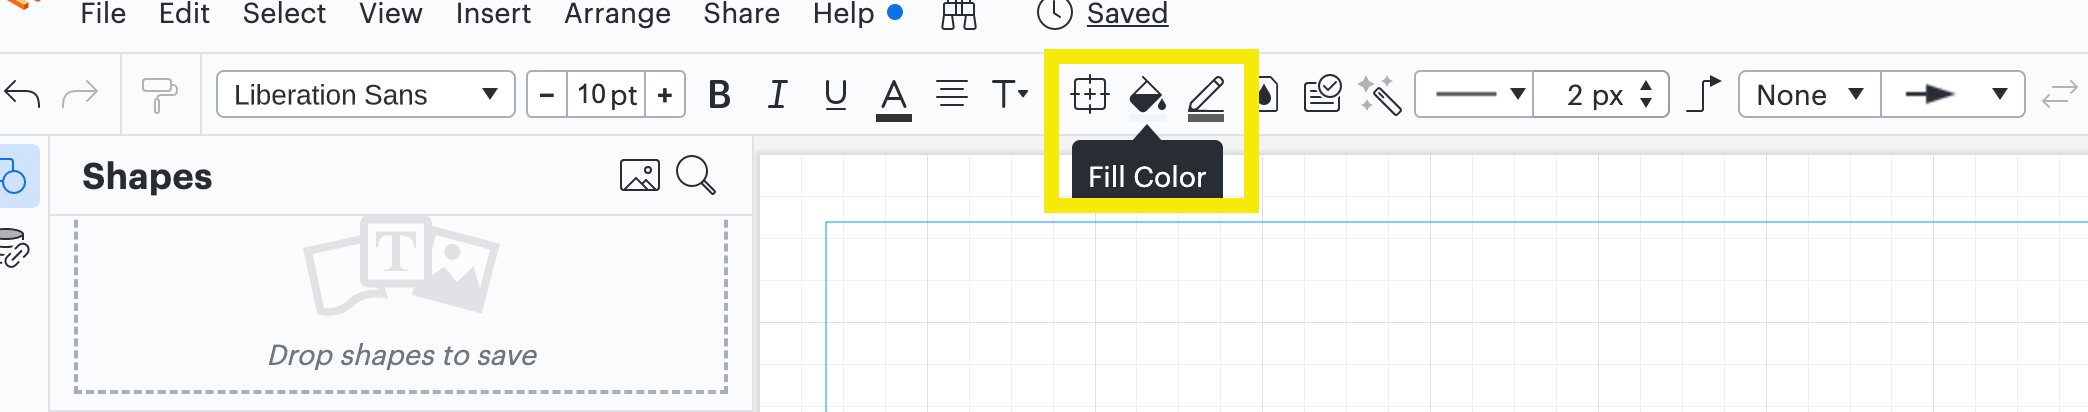
After you do that whatever shape you drag onto the canvas will be that color. You can switch colors throughout the process of placing the shapes down if you'd like. That way they don't have to all be that one color.
Once the shape is placed you will have the option to change the outline color. You can do this by clicking on the pencil icon next to the fill icon. If you'd like to be able to customize tabs by tab color please add more details about your use case or what you’d like to see in this experience posted in the Product Feedback section of the community - from here, other users can upvote it and add details of their own.
I apologize for any inconvenience this may cause you. Please let me know if you have any additional questions or concerns about this.