Hi Matt thanks for posting in the community - I'm happy to help! When importing a diagram via CSV line paths are determined by the Line Source and Line Destination fields. These are detailed in full in our Process Diagram Import from CSV article from the Lucidchart Help Center but the most important element here is to ensure that you're referencing the correct shapes that you want your lines to be drawn to and from as they are labeled within your CSV.
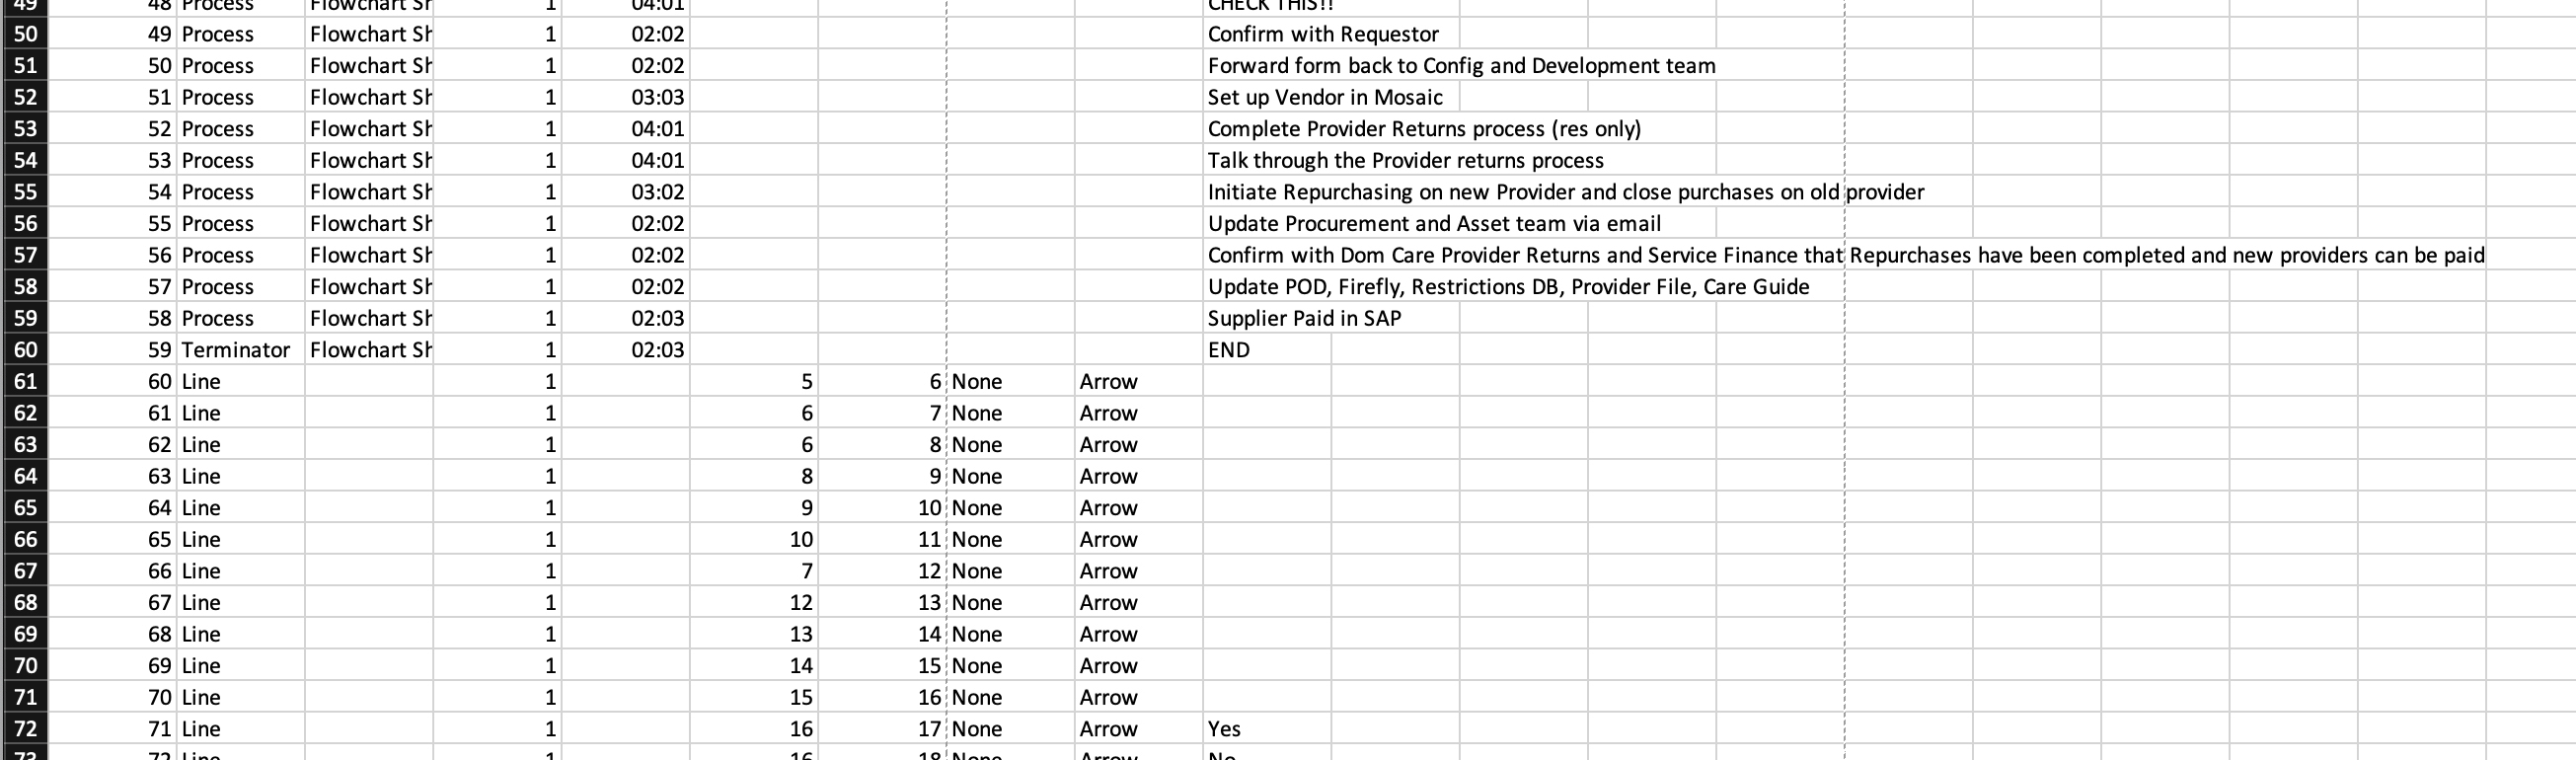
In your "Line" rows shown above in your screenshot I recommend ensuring that your shape references match the line in which those shapes are originally delineated in this CSV For example: in row 61 the line with ID 60 references shape IDs 5 and 6. I recommend double checking that the shapes with IDs 5 and 6 (even if they are in different rows of the CSV) are the ones you're hoping to reference here.
Additionally while this isn't visible in your screenshot above I also recommend taking a look at your setup for your swim lane container; it is necessary to specify both the shape and the column of the swimlane as documented here.
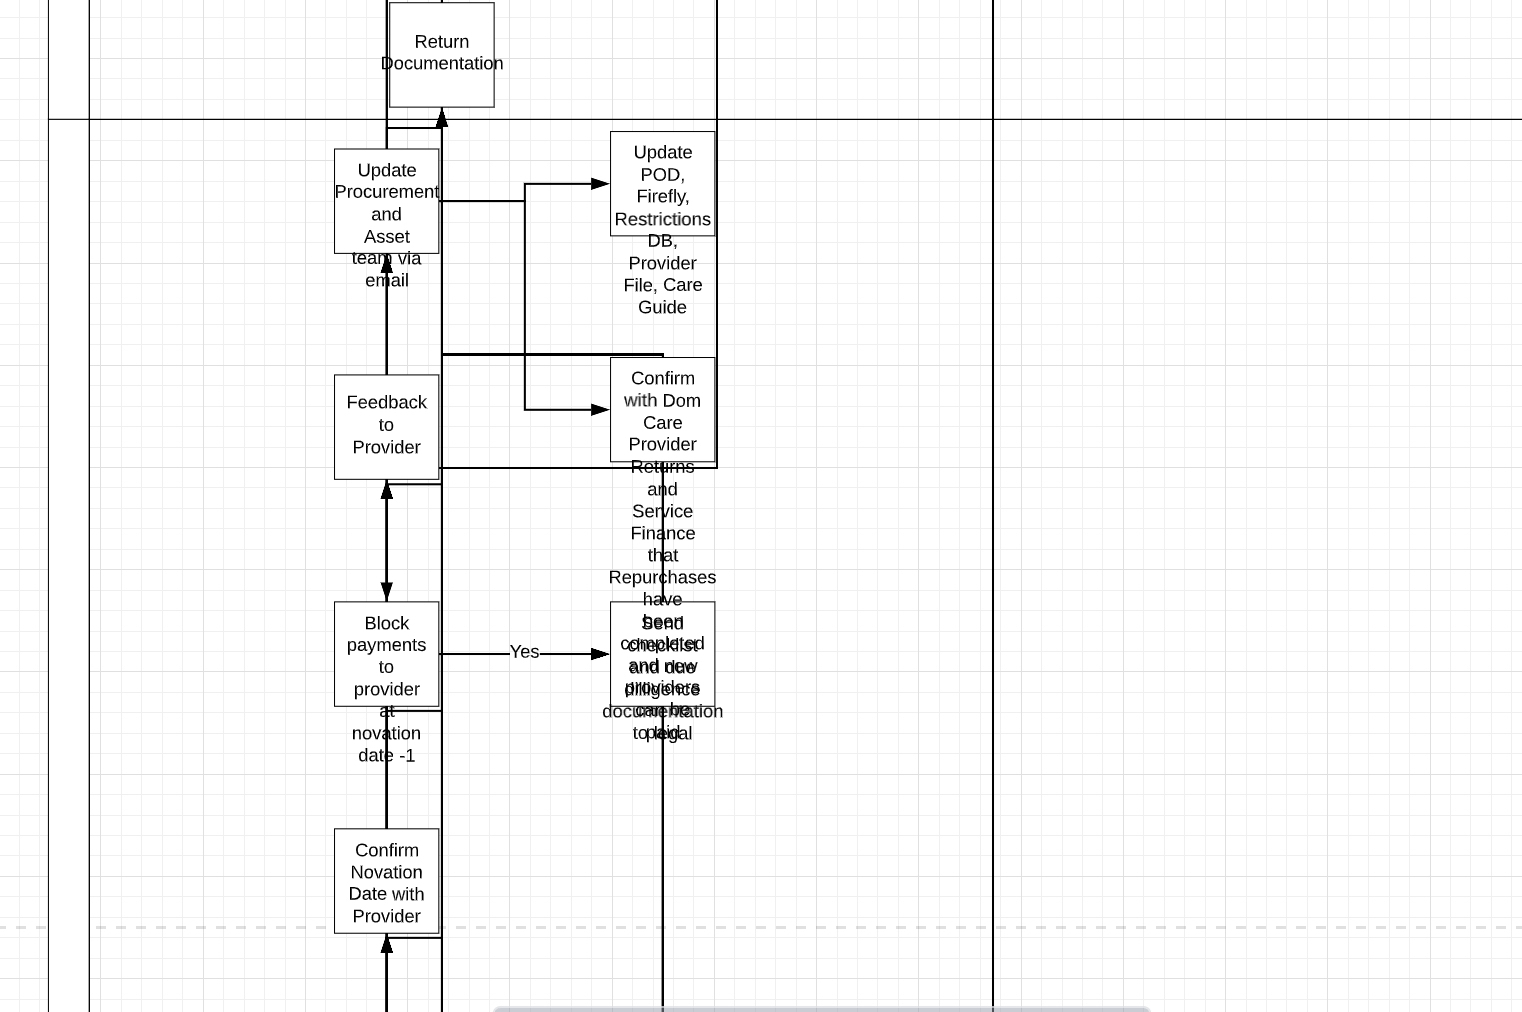
Finally please note that this is an experimental feature and may not work perfectly each time. Your diagram will also likely require additional polish and styling after import to ensure for example that your text is a font size that will fit within its corresponding shape.
Please let me know if you have additional questions about this!