How do I display my data on my shapes? I have project details including stakeholders frequency of communication deliverables for the project etc. in a Google Sheet. I’ve imported it and want to use it in conjunction with the Communication Plan template but I don’t know how to get my own data on the shapes!
Solved
How to show data on shapes with Data Linking
 +20
+20Best answer by Sami H
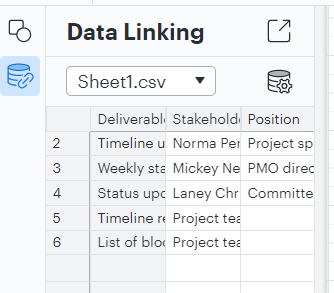
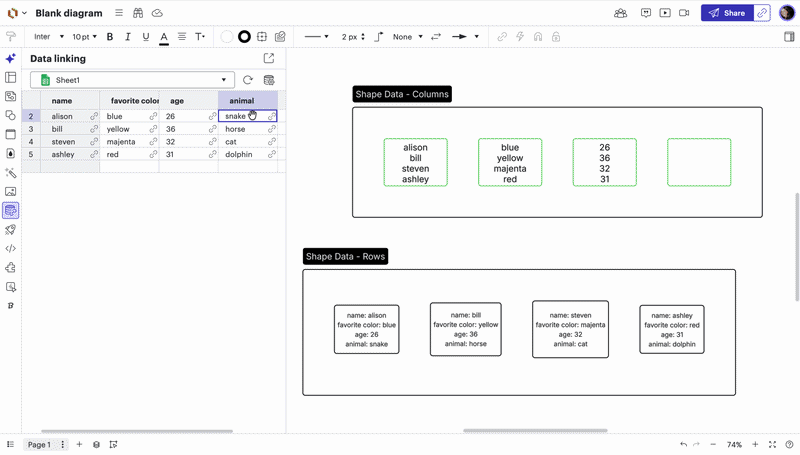
Hi there thanks for posting in the community! Once you’ve imported your data into Lucidchart using the Data Linking tool you can view and manage it in the Data Linking panel on the left of your editor.
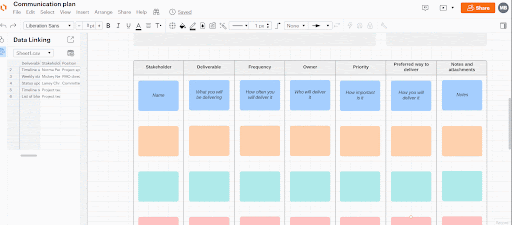
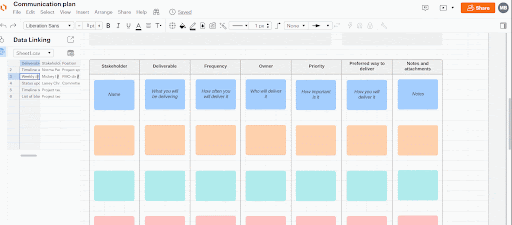
In order to display this data on your shapes in the template you’ll first need to attach the data to these shapes. You can do this by clicking and dragging the row of data to the shape with which you want to associate it. Once data is associated with a shape a small link icon will appear next to the data in the data panel.
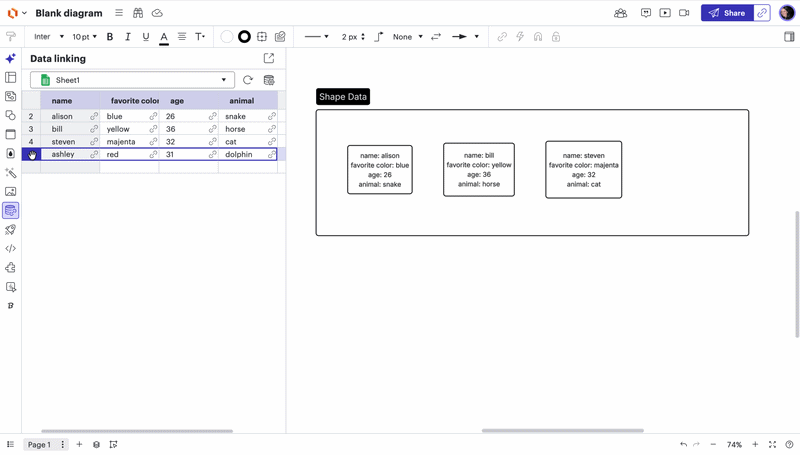
Finally to display the data on your shapes open the Shape Data panel on the right side of the editor then select the shape you want to work with. When you hover over the different data elements in the panel a +T icon will appear to the right. Simply click this icon to add the data to your shape! Note that you can do this for both a particular field (e.g. “Stakeholder”) as well as the value of that field (e.g. “Mickey Neilands.”)
I hope this helps! For more information please take a look at our Link Google Sheet Excel or CSV Data To Lucidchart Diagrams from the Lucidchart Help Center and post any additional questions below!
____________________________________________________________________________
¿Habla español? ¡Haga una pregunta aquí!
Fala português? Faça uma pergunta aqui!

Create an account in the community
A Lucid or airfocus account is required to interact with the Community, and your participation is subject to the Supplemental Lucid Community Terms. You may not participate in the Community if you are under 18. You will be redirected to the Lucid or airfocus app to log in.
Log in to the community
A Lucid or airfocus account is required to interact with the Community, and your participation is subject to the Supplemental Lucid Community Terms. You may not participate in the Community if you are under 18. You will be redirected to the Lucid or airfocus app to log in.
Log in with Lucid Log in with airfocus
or
Enter your E-mail address. We'll send you an e-mail with instructions to reset your password.