Hi @claude f thank you for posting in the community! I'd be happy to share some resources that may help you work with Gantt Charts.
I would recommend using the timeline feature in Lucidspark when creating a Gantt Chart! For more information on this feature please take a look at the Timelines article from the Lucidspark Help Center. I also highly recommend this community post about working with a Gantt Charts in Lucidspark for a demonstration of this feature - it has a lot of details and discussion about this feature!
Please let me know if this isn't what you are looking for or if you have any questions! We are happy to help. Cheers! :)
Thanks @leianne c - i am trying the timeline article but immediately getting stymied as I don't see the Timeline icon in the toolbar and not finding help topics on that. Also not finding the timeline context menu. I did find Timeline shapes in the Shapes Library but not having any luck with the other stuff.
Could this be related to my account subscription level? I am subscribed through a corporate account so I think i should not have limited access.
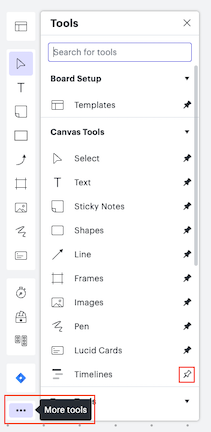
Hi @claude f! It sounds like the Timeline icon is hidden in your Lucidspark tool bar. To add that the the tool bar click the three dot "More Tools' menu at the bottom of the Primary Toolbar and look for 'Timeline' in the list of tools. From there you should be able to pin it to your toolbar by clicking the pin icon. This Help Center article has some additional information about the Lucidspark editor!
Would you mind giving this a try? Please let me know if you're still not able to access the Timeline feature or if you have any questions!
not only do I not see the see More Tools dots i don't see the primary toolbar you have on your screen. I've looked though all the menu's trying to turn this on and checked Help but just don't see how to activate my primary toolbar.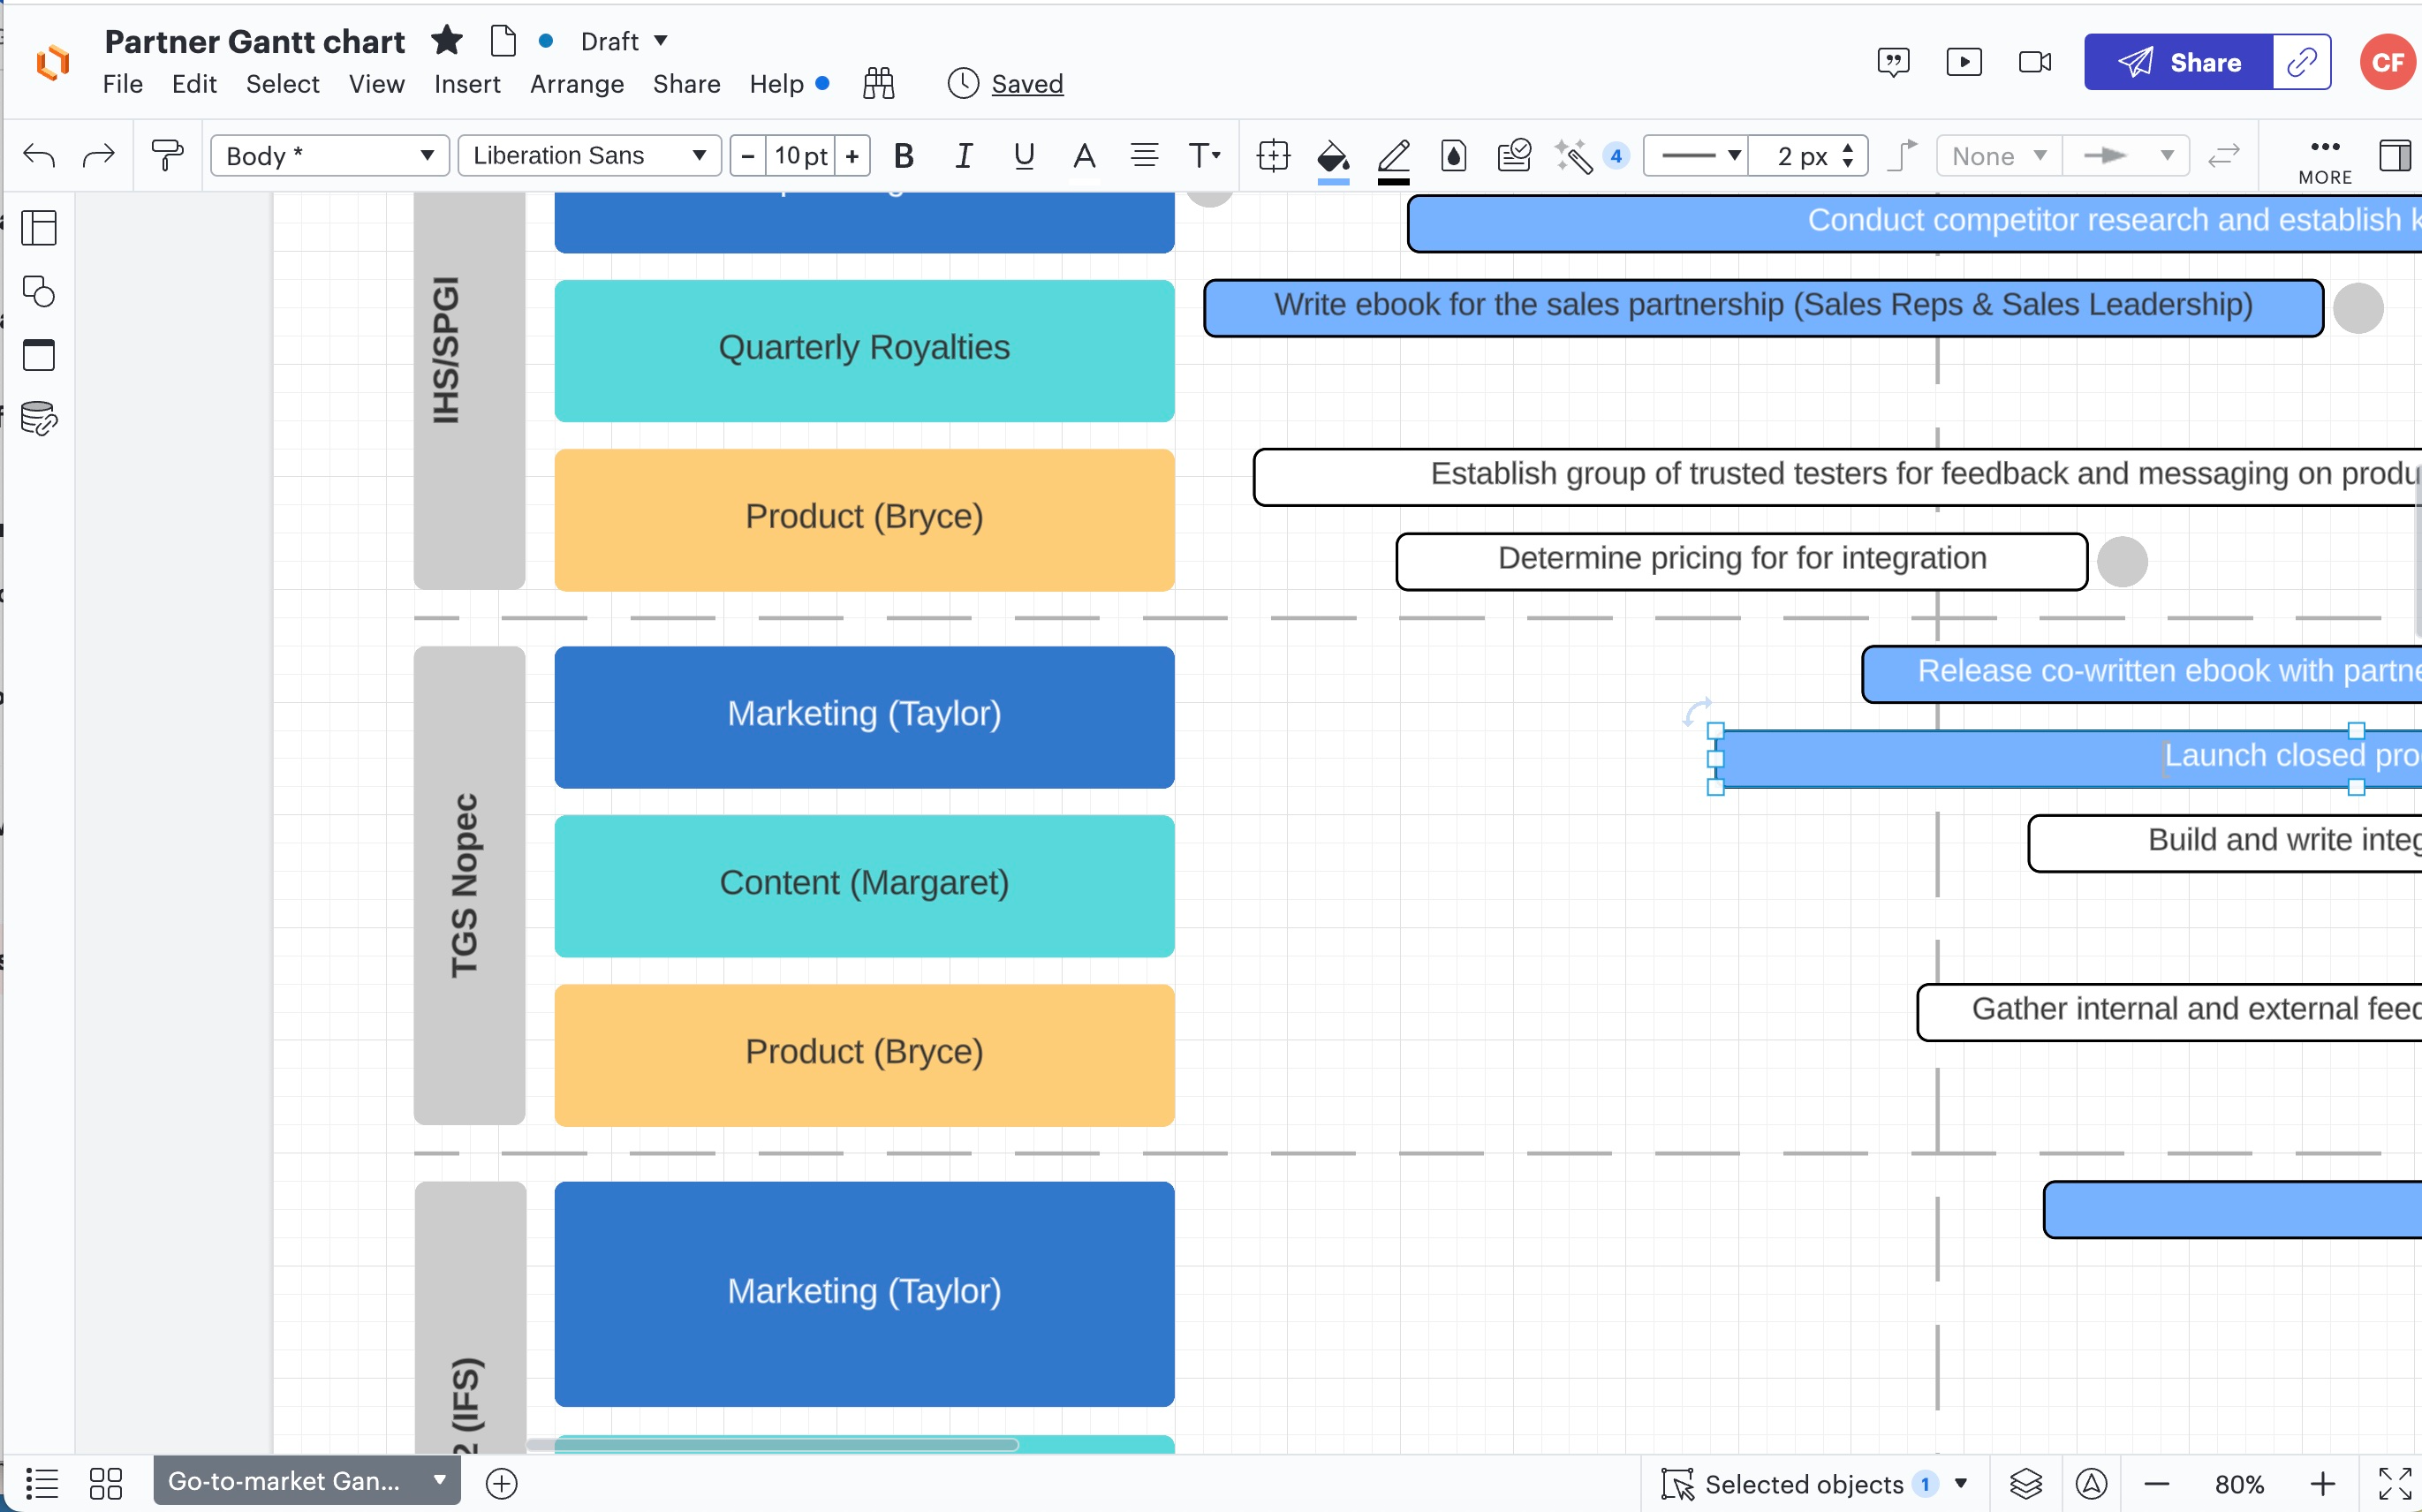
Hi @claude f thank you for sharing a screenshot of what you're seeing and apologies for the confusion! It looks like you are using Lucidchart our diagramming tool. The Timelines feature is actually available in our cloud-based whiteboard tool Lucidspark which is why you are not able to see the primary tool bar.
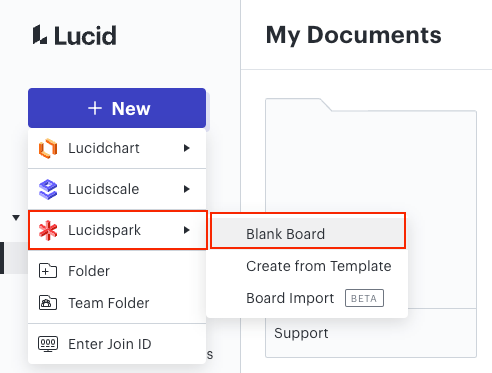
If you have access to the product you should be able to create a new board from your 'My Documents' page by clicking '+New' and selecting Lucidspark from the options.
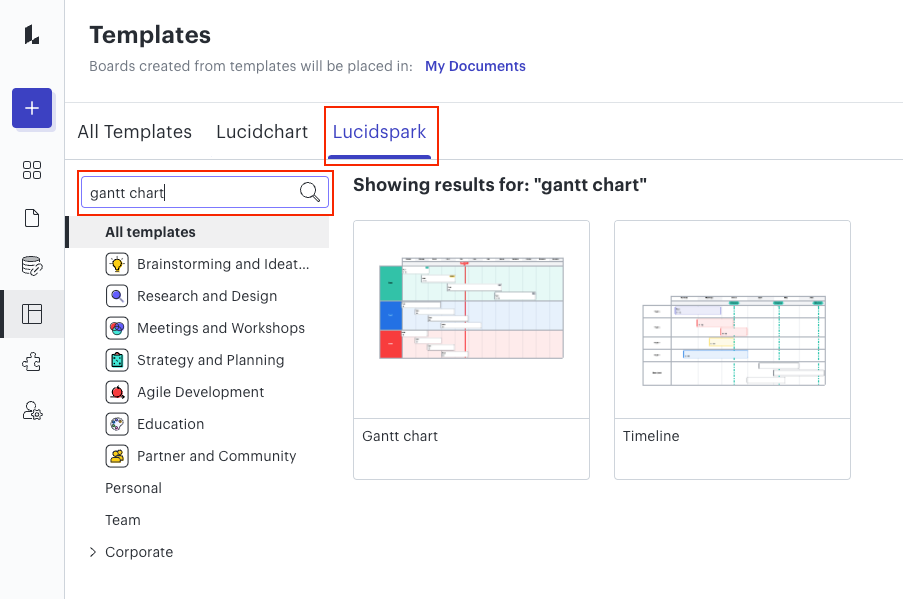
Alternatively we also have some Gantt Chart templates that were created with Lucidspark available in the Templates gallery:
Alternatively if you would like to create the Gantt Chart in Lucidchart you will need to use our Data-linking feature along with Conditional Formatting to achieve something similar to the template you are using in your screenshot.
Please let me now if you're having trouble with any of the above or if you have any questions. Hope this helps!