
Solved
Formatting labels on smart containers in Lucidchart
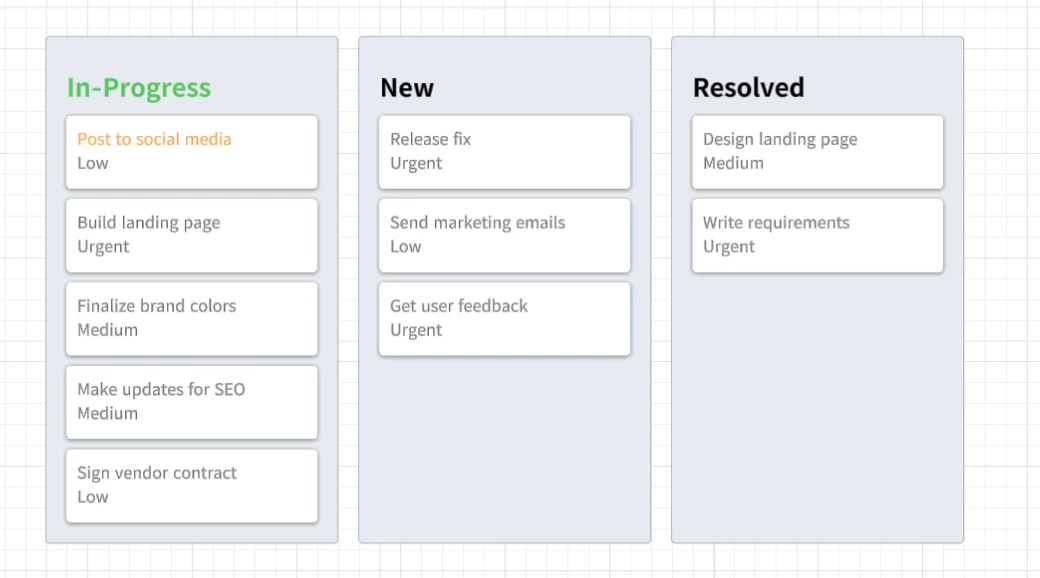
I’m exploring the use of smart containers as a way to visualise various data from user research projects within one service (there is a lot) and to also be able to link those insights to other big data insights across the service.
I have a lot of fields and would like to be able to format the label text for them however I can’t seem to do this. I’m unable to highlight the label text, let alone format it. Is there any way around this that I’m missing?

 Your privacy choices


