I don’t think Lucid should be applying CORS to published diagrams. For over 7 years I have embedded the published link from lucid in my Azure DevOps wiki pages. They all stopped working sometime within the last month due to CORS errors. Please fix, this would be an error on Lucid’s end. You should permit all ‘*’ origins and not restrict them. At a minimum add dev.azure.com to your allowed origins.
Solved
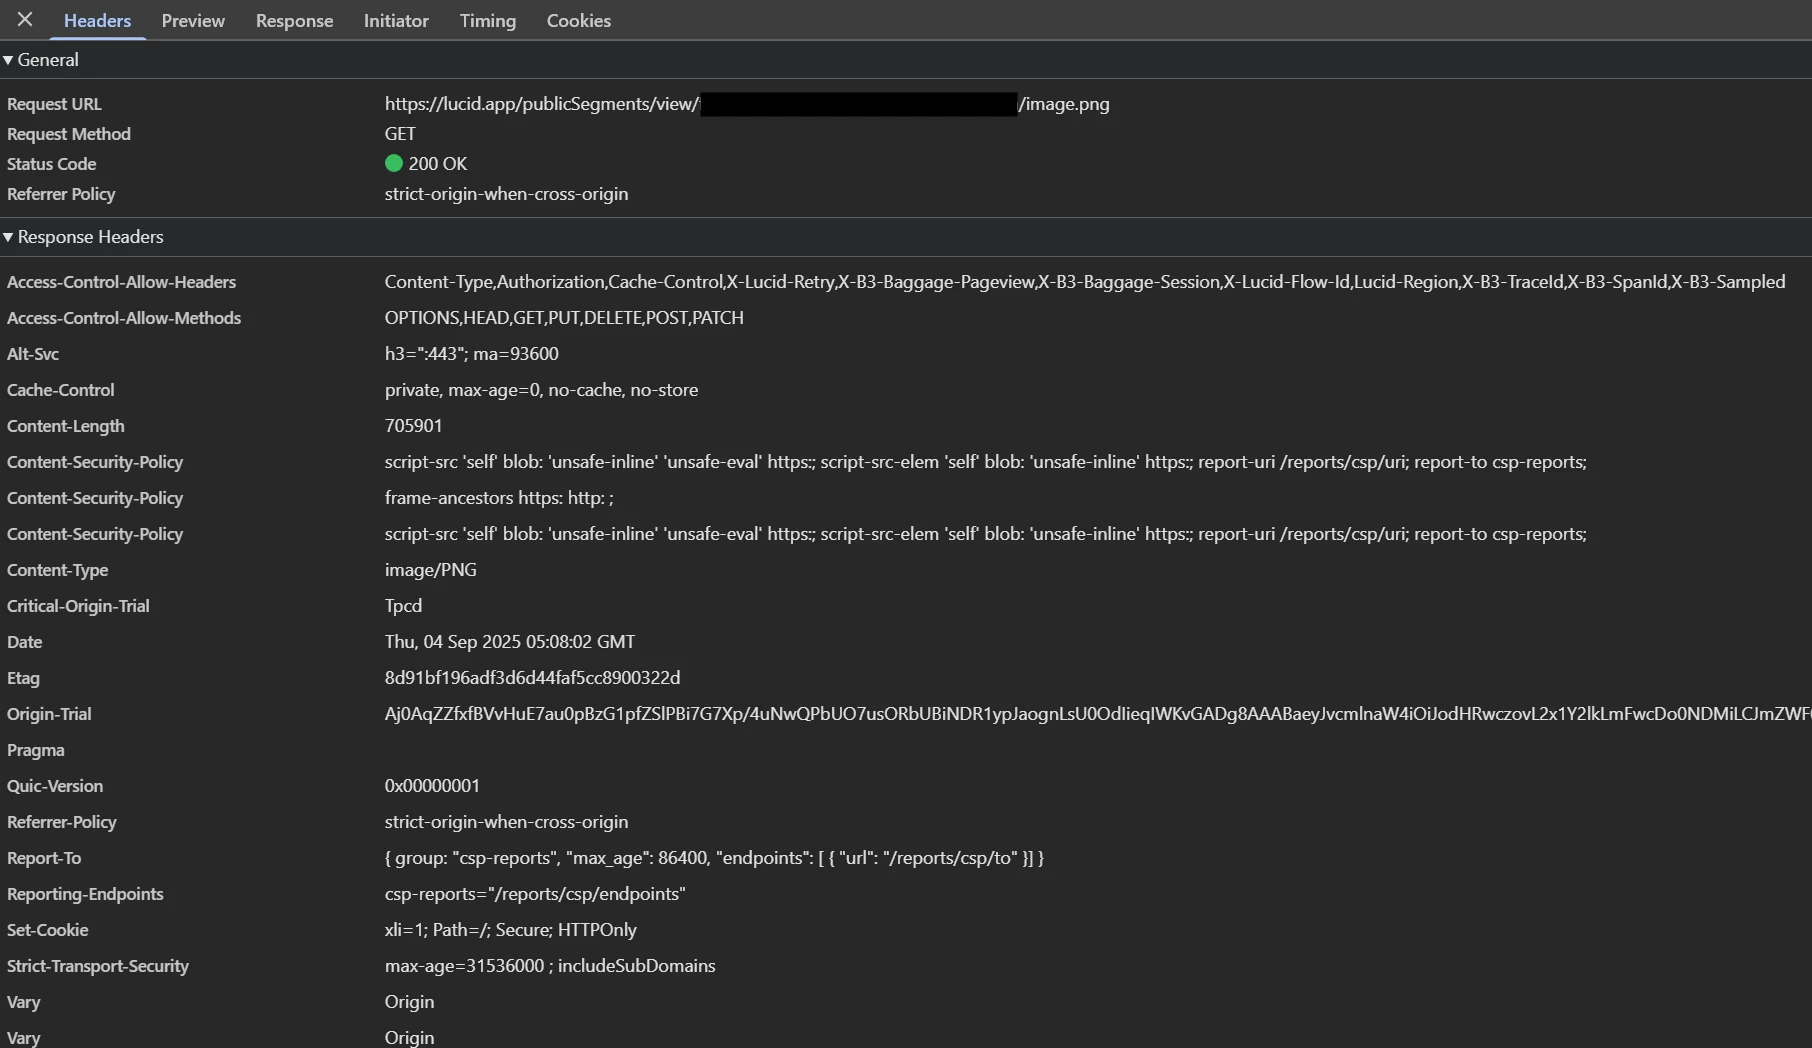
CORS is blocking embedded Lucid diagram in Azure DevOps wiki
 +1
+1Best answer by Leianne C
Hi


Create an account in the community
A Lucid or airfocus account is required to interact with the Community, and your participation is subject to the Supplemental Lucid Community Terms. You may not participate in the Community if you are under 18. You will be redirected to the Lucid or airfocus app to log in.
Log in to the community
A Lucid or airfocus account is required to interact with the Community, and your participation is subject to the Supplemental Lucid Community Terms. You may not participate in the Community if you are under 18. You will be redirected to the Lucid or airfocus app to log in.
Log in with Lucid Log in with airfocus
or
Enter your E-mail address. We'll send you an e-mail with instructions to reset your password.