I'd like to use the cards from org charts in other diagrams. For example when creating meetings in LucidSpark I'd like to paste in the attendees from our org chart.
Org charts don't seem to act as real diagrams and shapes. Is it possible to copy and paste these as LucidChart objects so that they just become shapes that can be dragged around diagrams?
The SVG export might be one way - but it doesn't then seem possible to reimport the SVG easily.
Best answer by alison cheney
Hi @nathaniel.bullock,
Thank you for your response here!
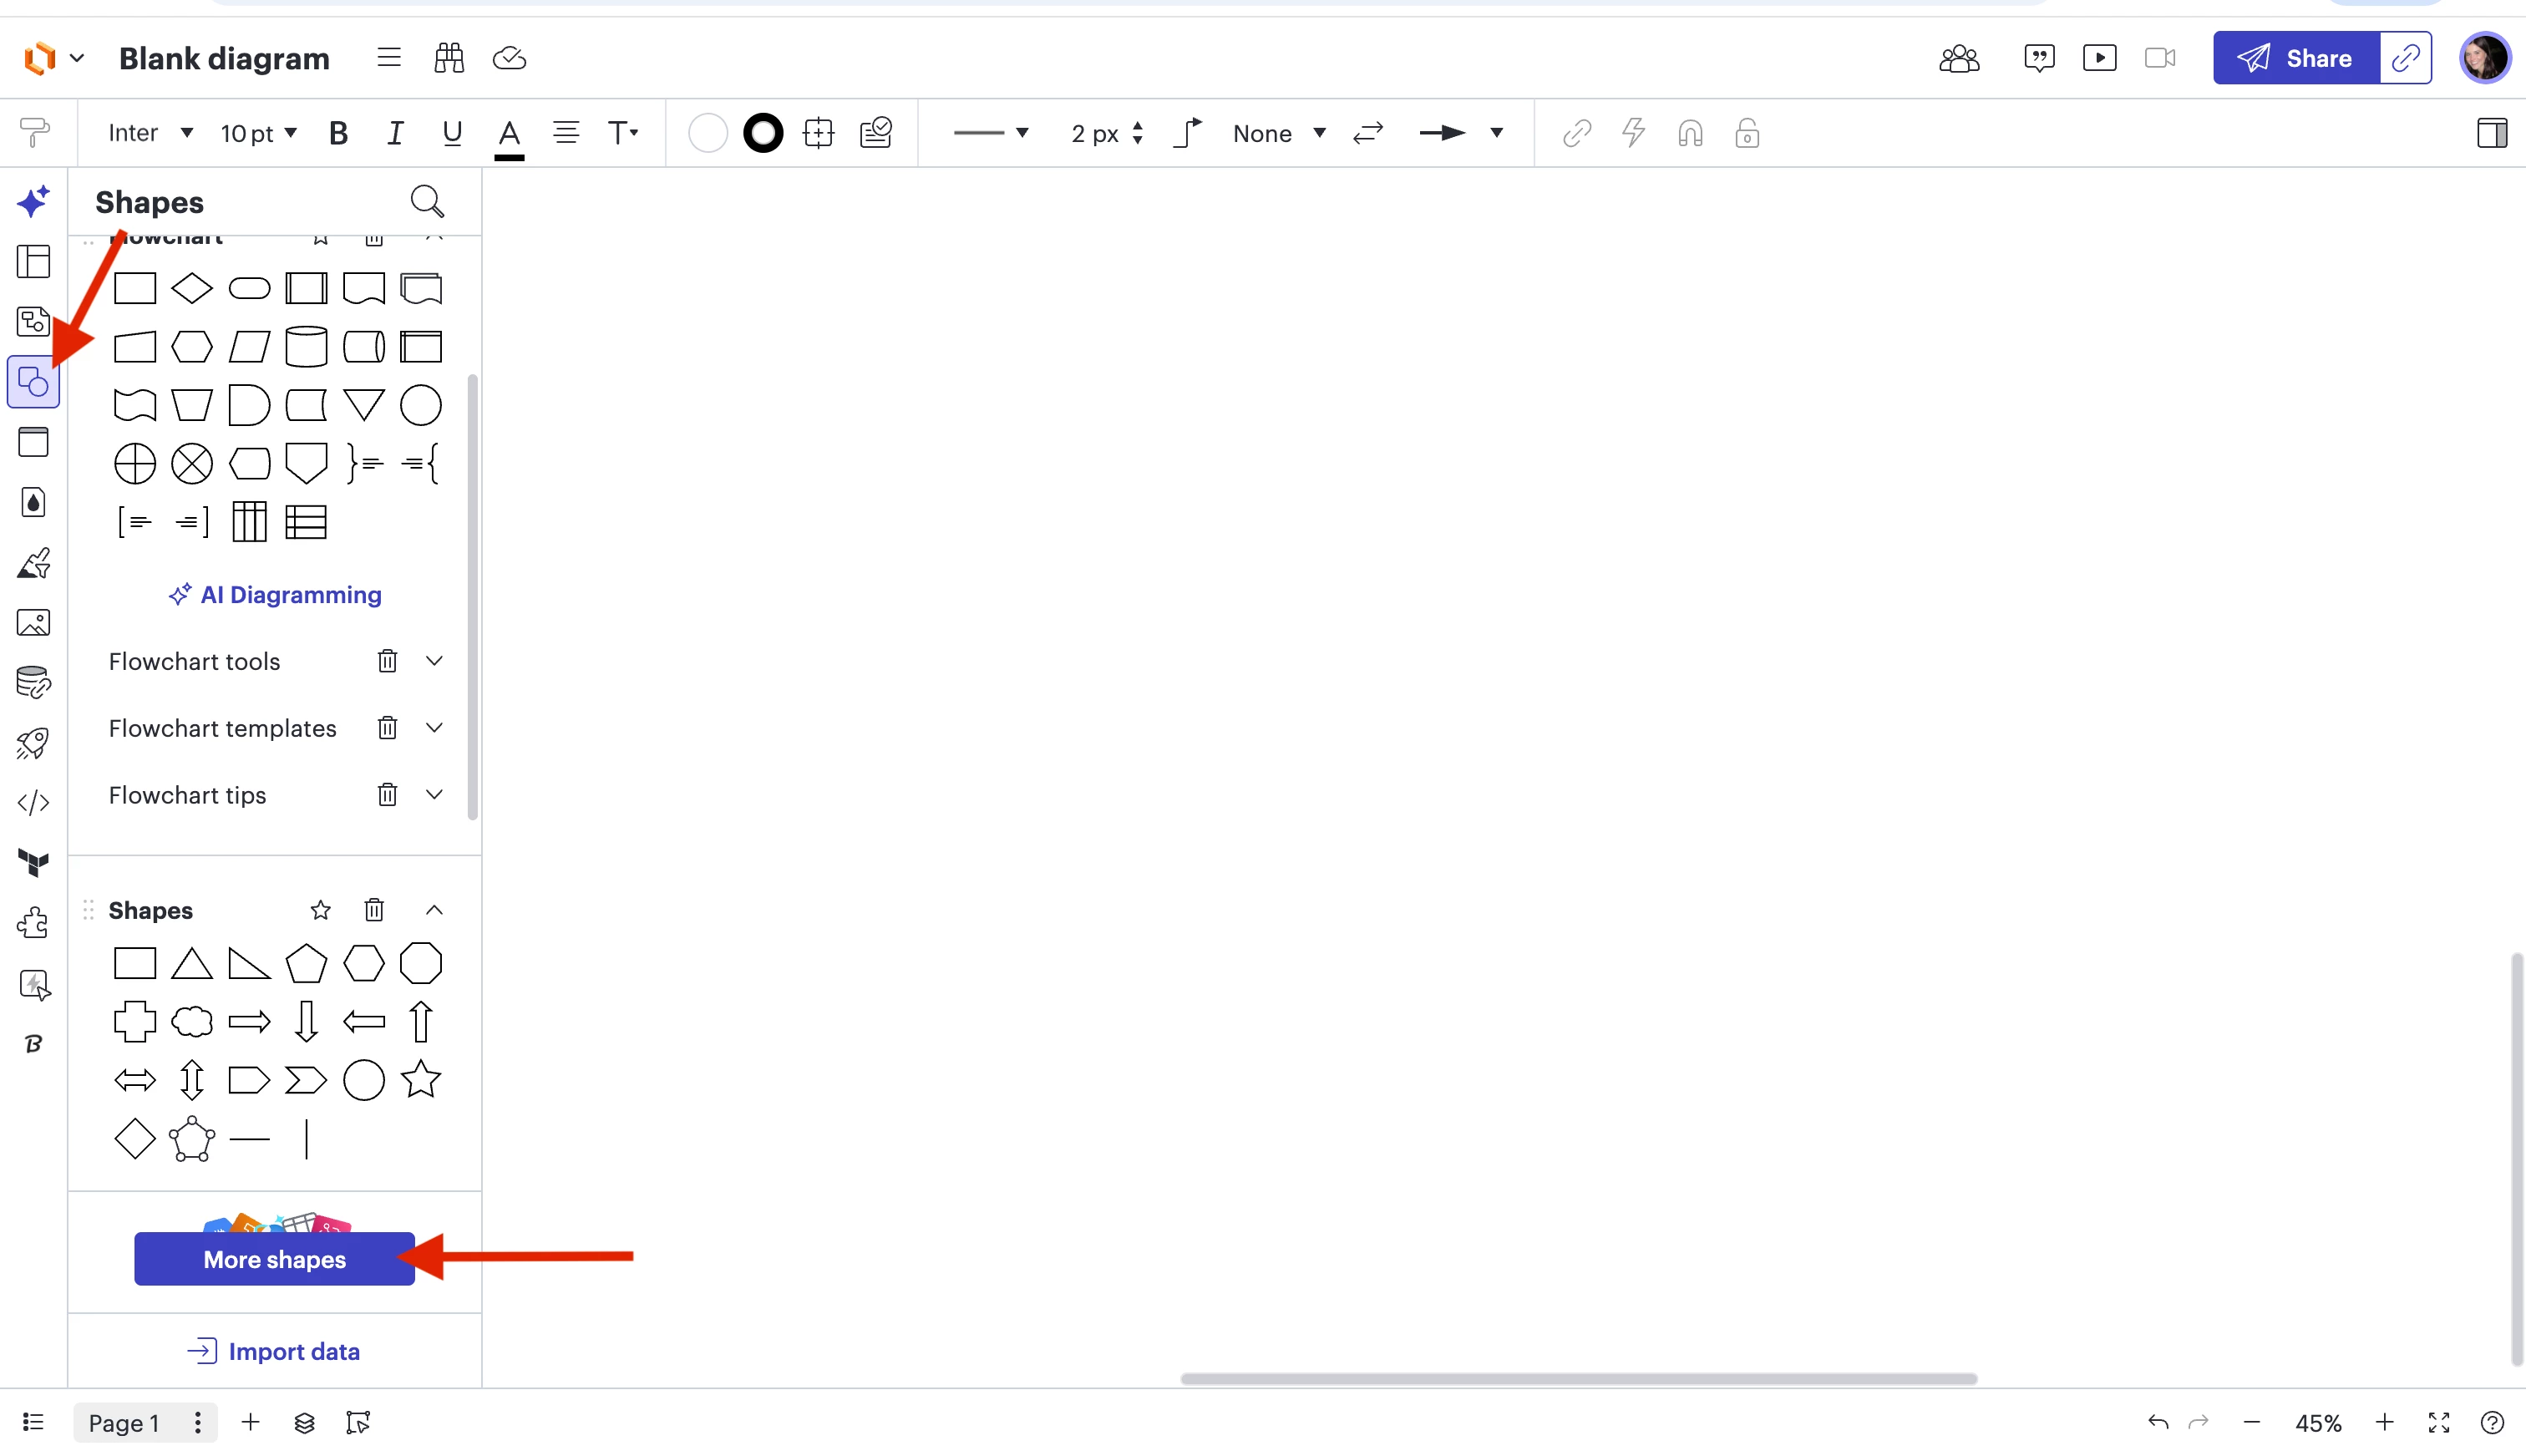
Since you mentioned you want to be able to manually set the layout of your org chart, here are a few steps to build an org chart manually. (see screenshots below)
Select your Shapes panel and Click “More shapes”
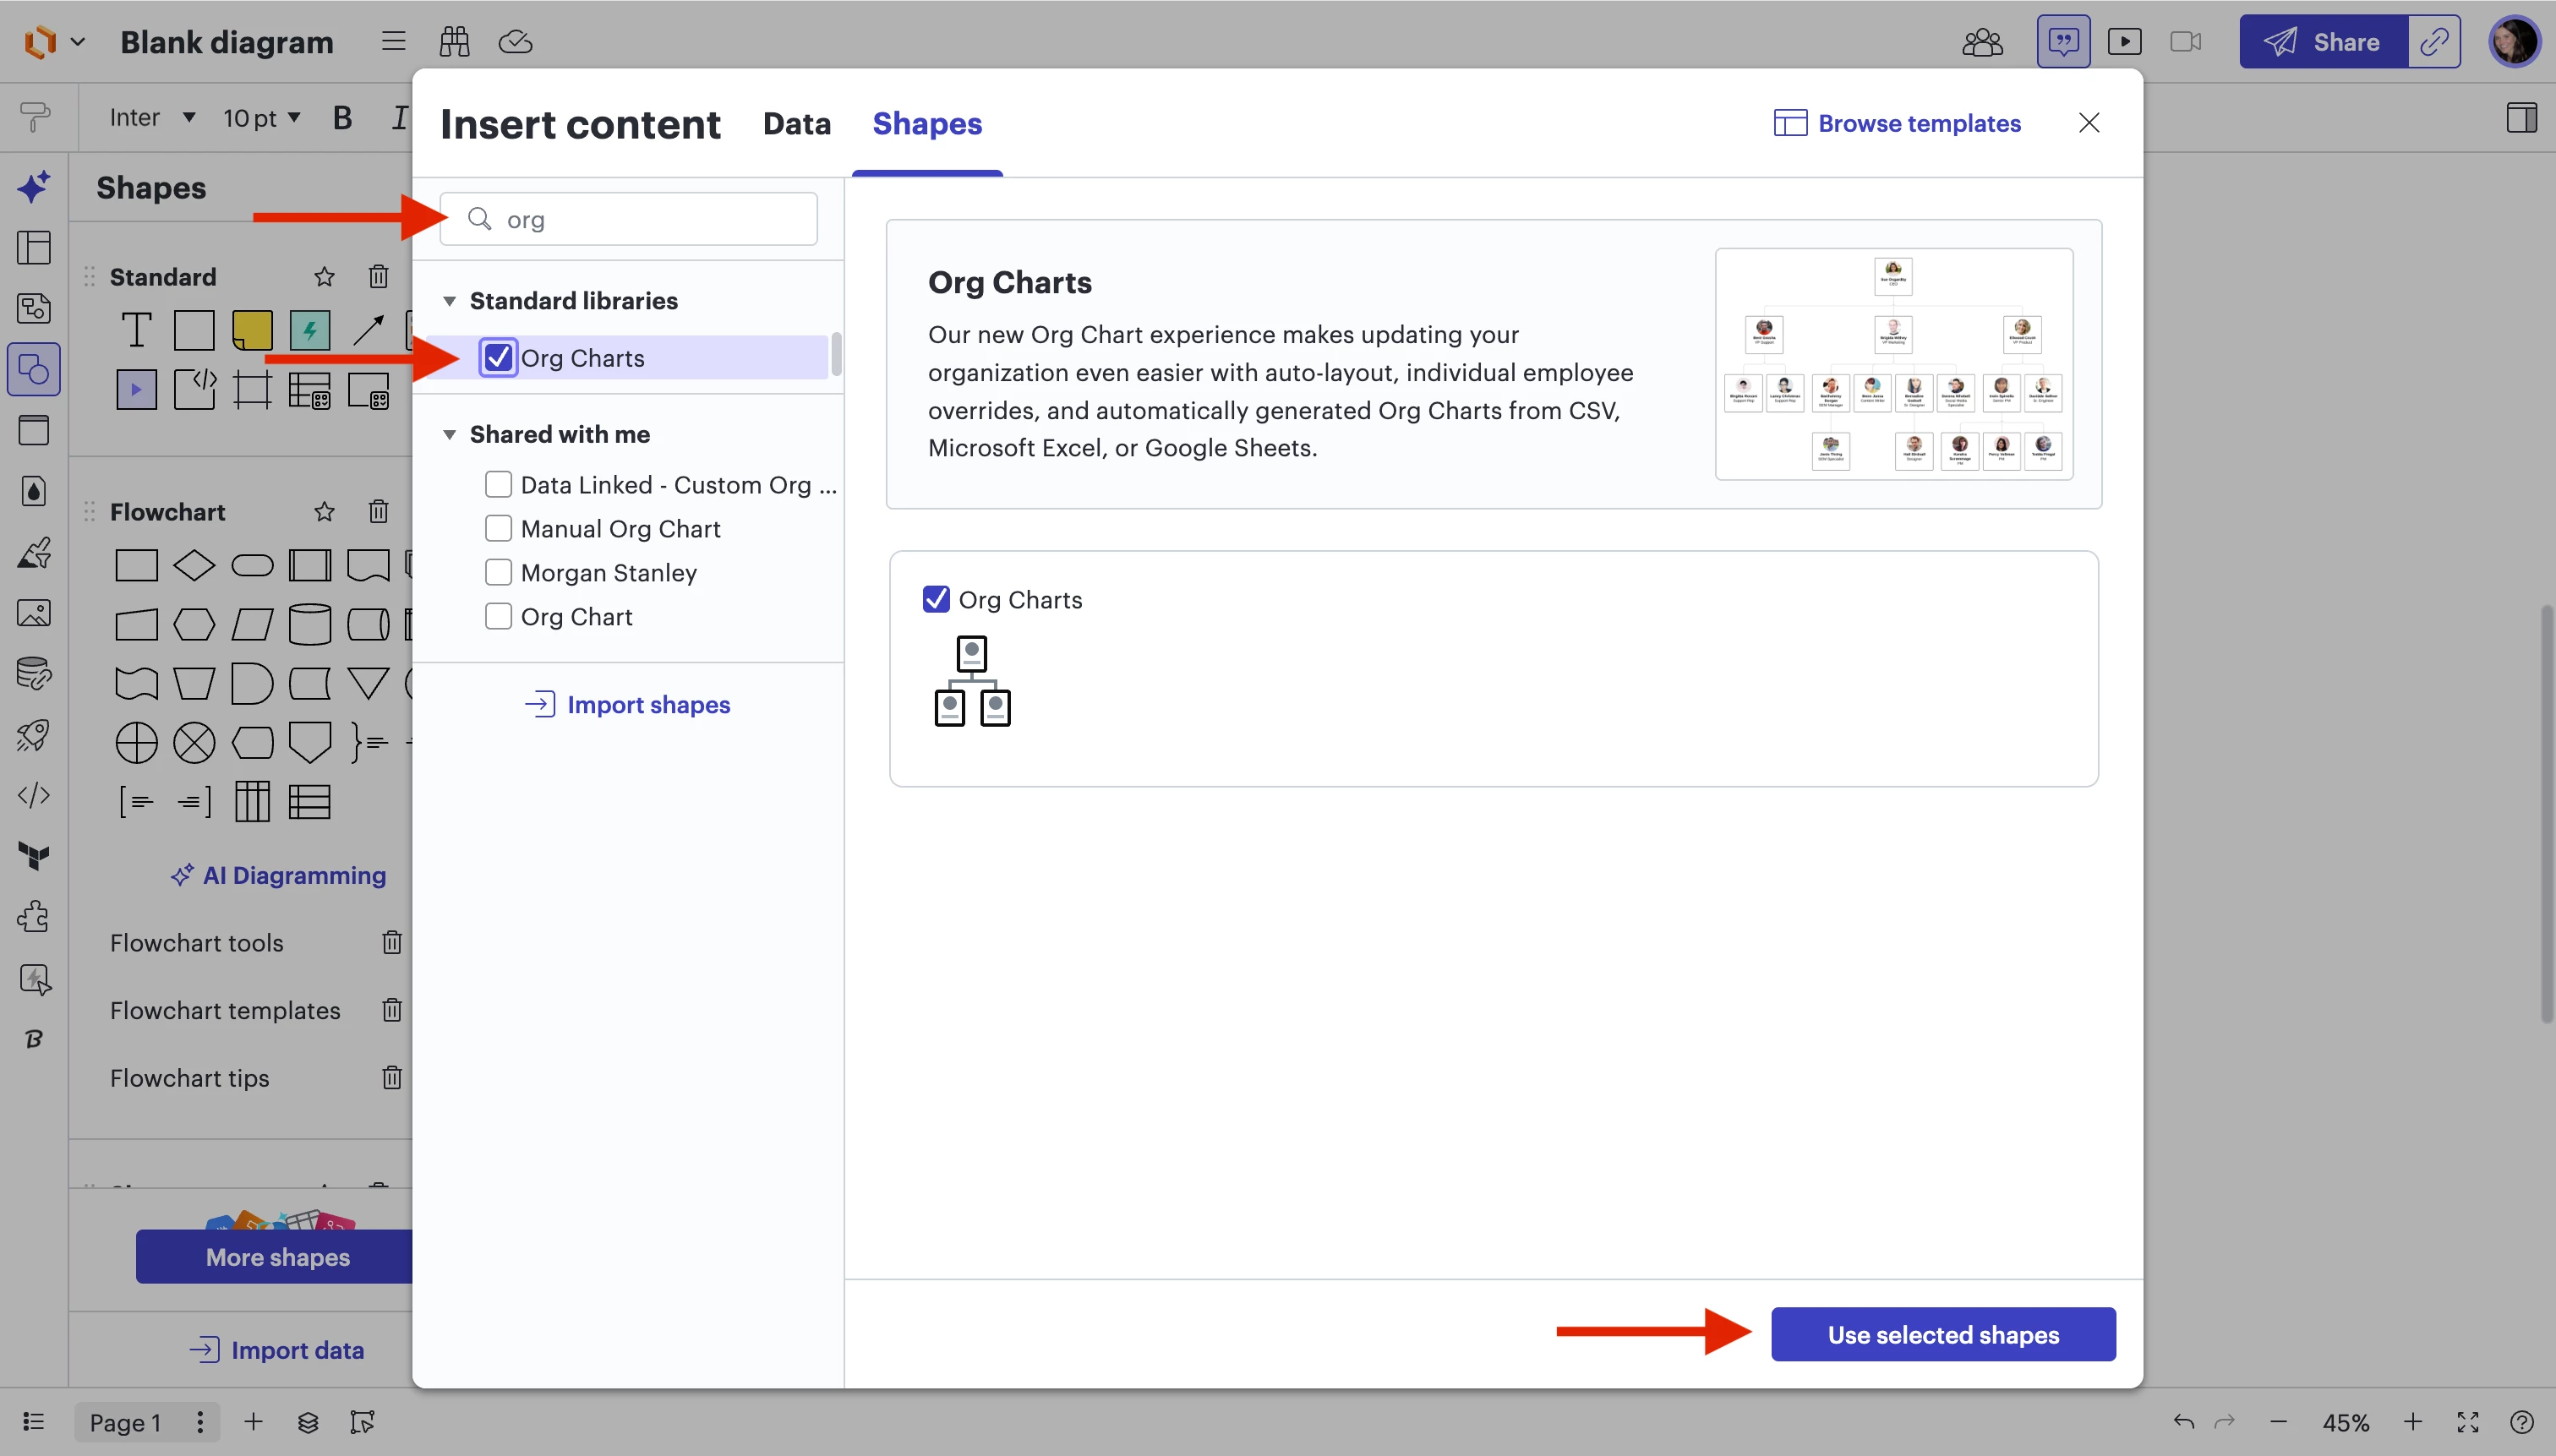
Search for “Org charts” and click “Use selected shapes”
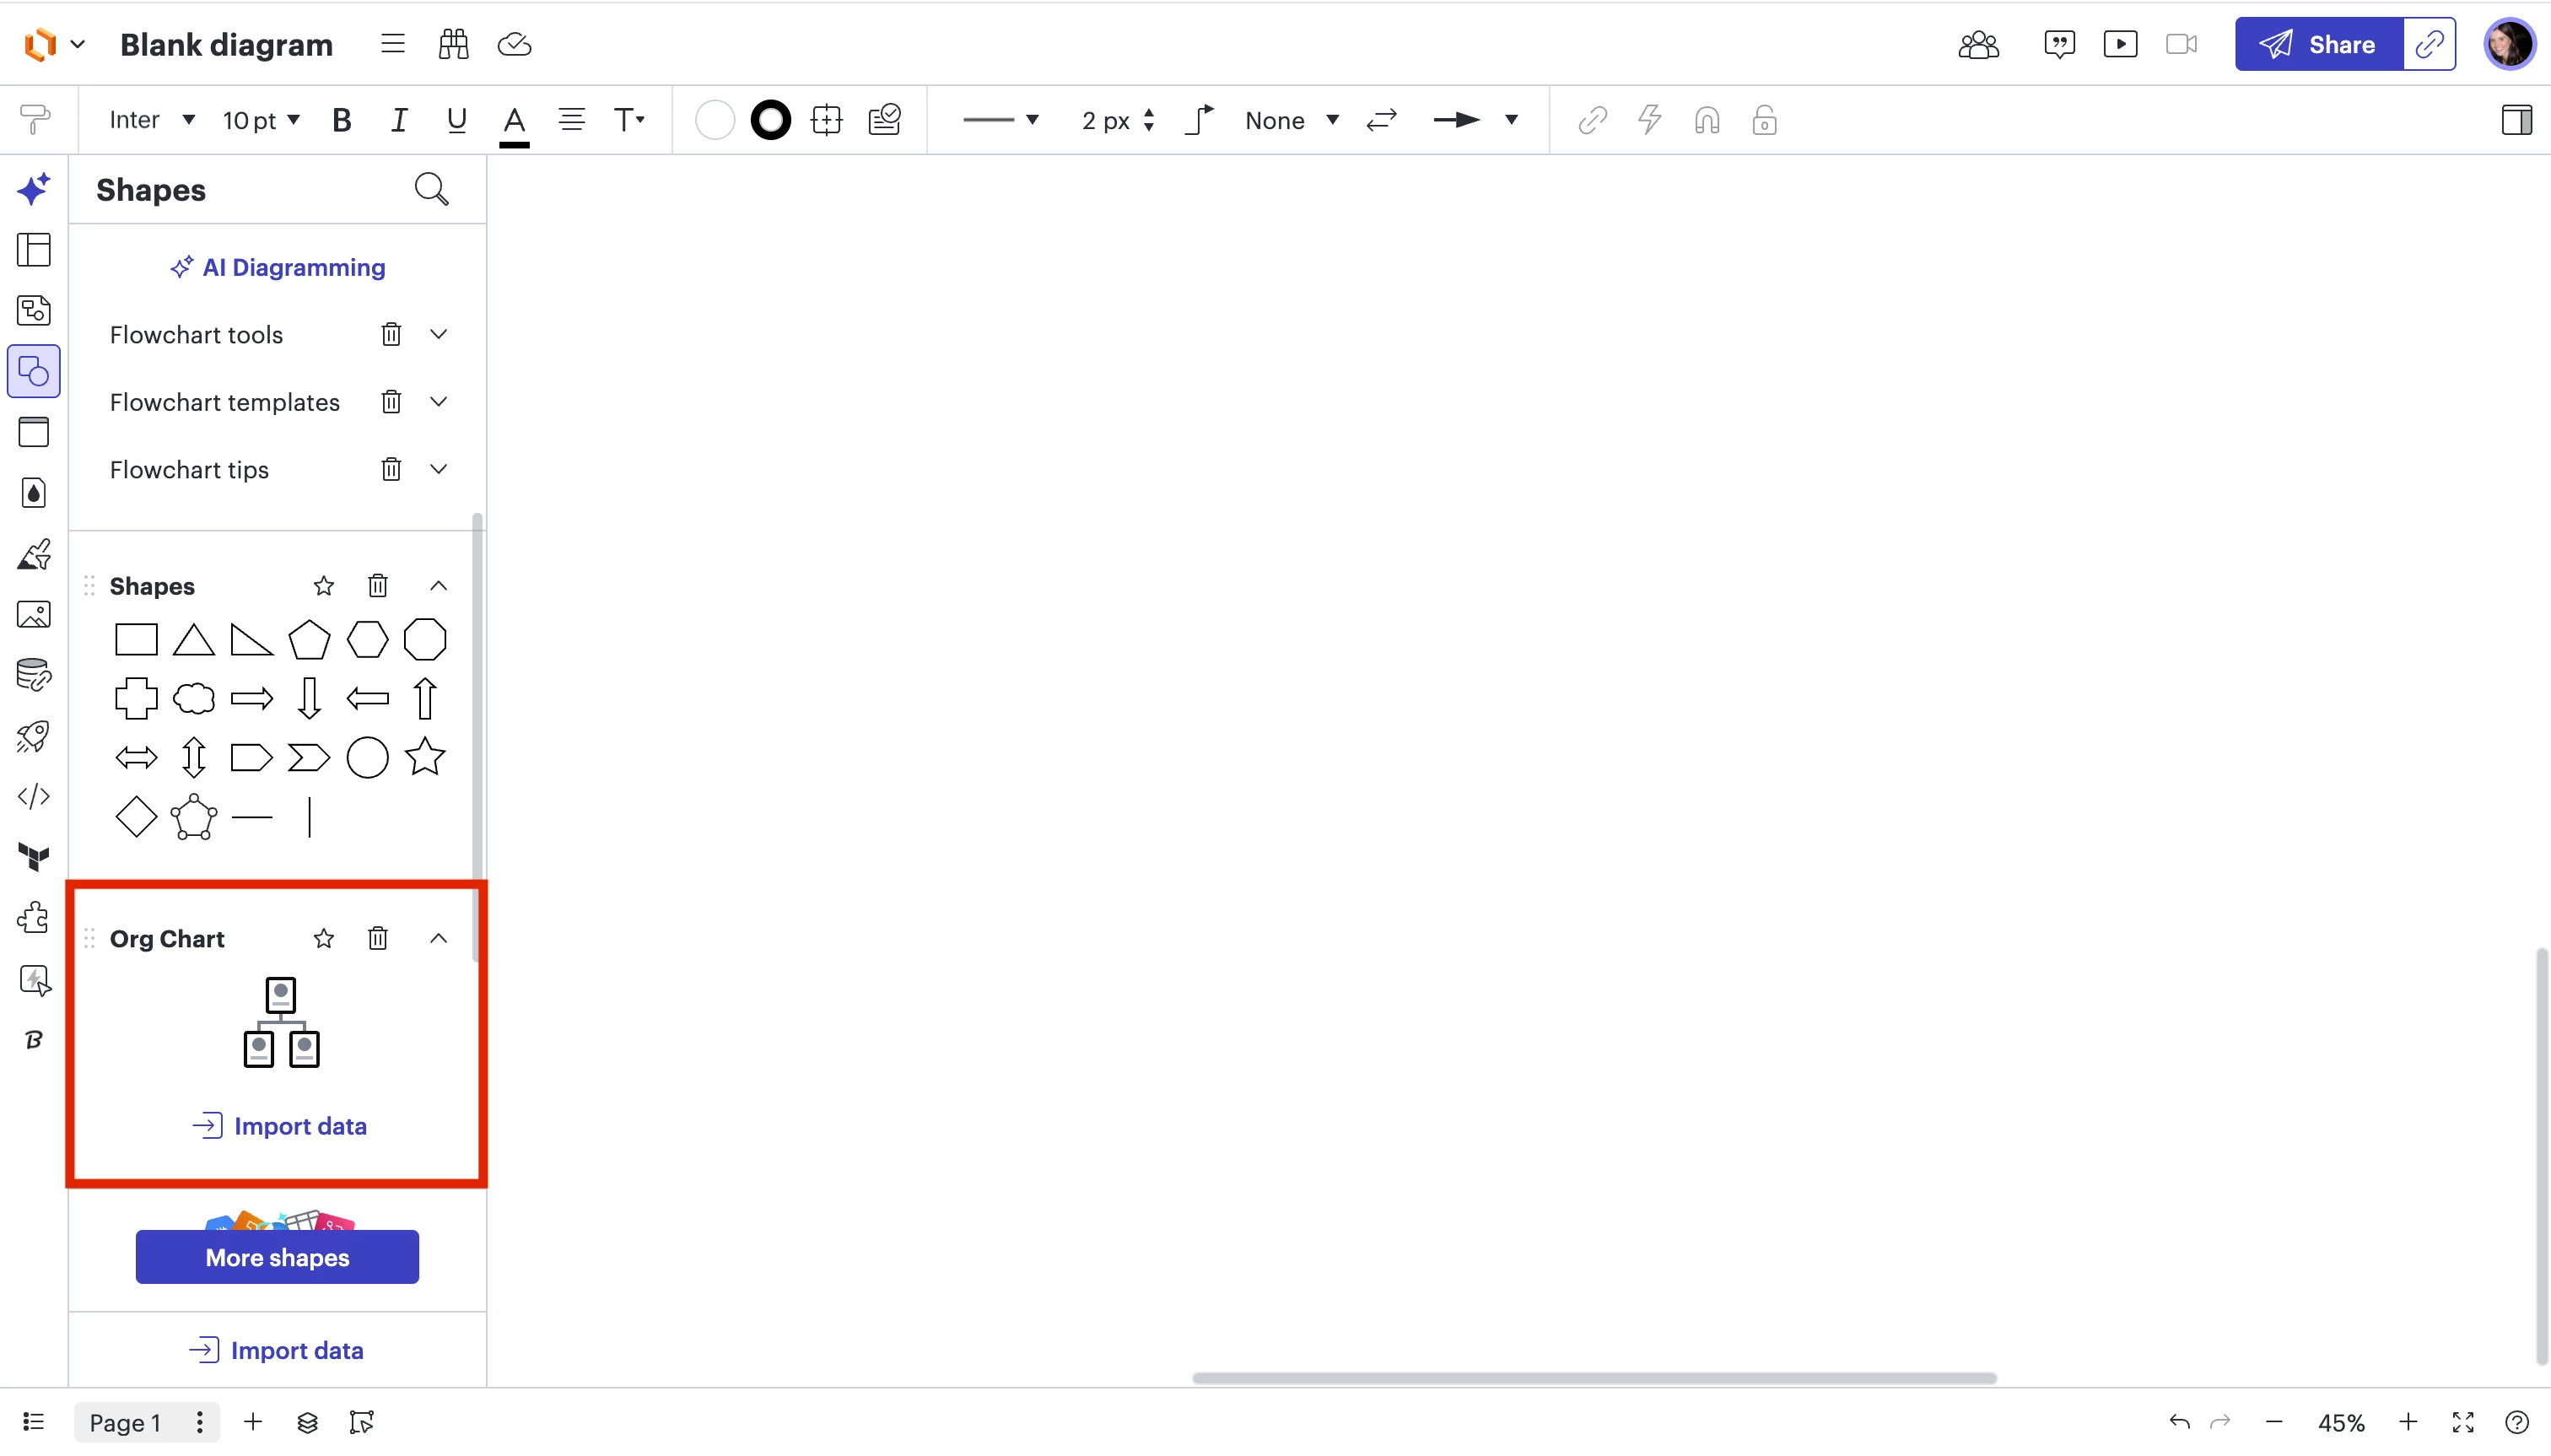
You can now access the org chart shape from the Shape menu in your document. Once it’s on the canvas, you can add, move, and edit individual shapes as needed to fully customize your org chart.
Alternatively, to make it less cumbersome for your workflow, I would suggest linking data to shapes using Data linking. This will allow you to create and move your own org chart shapes independently, provide more layout options, and remove the barrier of having to replace your data sheet.
To assign data to an object, follow these steps:
Click the Data Panel icon from the Primary Toolbar to the far left-hand side.
Locate the cell or row of data you would like to assign to an object on your canvas.
Drag and drop the cell or row of data onto the object.
Tip: You can also drag and drop a cell or row of data directly onto the canvas to create a new shape linked to that data.
Please let me know if this supports your workflow and if you have any additional questions!
Thanks for posting in the Lucid Community! You certainly can copy/paste your Org Chart shapes within Lucidchart and Lucidspark. Make sure you double click into the Org Chart select and card and use Ctrl/Cmmd + C and Ctr/Cmmd + V.
You could also create a storage place of these separated cards on a separate page in Lucidchart or Lucidspark for easier use or copy and paste the entire Org Chart into Lucidspark. Hope this helps -- let me know if you have any other questions!
Hi @nathaniel.bullock, thanks for adding to this thread! You can certainly generate an org chart using data.
To get started, I recommend reading through this resource to learn more about importing exisiting org chart data. As a best practice, we recommend building your org chart by importing data if:
You have a data source with your org chart information.
You want the ability to replace or refresh org chart data to make updates.
You have a larger organization that requires frequent or complex chart changes.
Would you mind clarifying what you’re hoping to achieve by copy/pasting your org chart shapes? What further editing are you hoping for? There may be a better solution depending on what you’re trying to achieve! You can always further customize your org charts, and I recommend this resource for some great tips on how to do so.
I want to be able to manually set the layout. I also want to be able to use the regular data linking functionality to update my charts. I’ve been creating these charts by hand which has been time consuming. The org chart function seems great for generating them, but the limited layout options, and the fact that I have to use a separate interface for replacing the data makes it less convenient.
I’ve been creating multiple charts in different layers. With all the datasets in one place it’s relatively simple to tab through them and replace the datasets. Between the regular data linking, the org charts, and smart containers I’m having to replace datasets in 3 different places.
Since you mentioned you want to be able to manually set the layout of your org chart, here are a few steps to build an org chart manually. (see screenshots below)
Select your Shapes panel and Click “More shapes”
Search for “Org charts” and click “Use selected shapes”
You can now access the org chart shape from the Shape menu in your document. Once it’s on the canvas, you can add, move, and edit individual shapes as needed to fully customize your org chart.
Alternatively, to make it less cumbersome for your workflow, I would suggest linking data to shapes using Data linking. This will allow you to create and move your own org chart shapes independently, provide more layout options, and remove the barrier of having to replace your data sheet.
To assign data to an object, follow these steps:
Click the Data Panel icon from the Primary Toolbar to the far left-hand side.
Locate the cell or row of data you would like to assign to an object on your canvas.
Drag and drop the cell or row of data onto the object.
Tip: You can also drag and drop a cell or row of data directly onto the canvas to create a new shape linked to that data.
Please let me know if this supports your workflow and if you have any additional questions!
A Lucid or airfocus account is required to interact with the Community, and your participation is subject to the
Supplemental Lucid Community Terms.
You may not participate in the Community if you are under 18. You will be redirected to the Lucid or airfocus app to log in.
A Lucid or airfocus account is required to interact with the Community, and your participation is subject to the
Supplemental Lucid Community Terms.
You may not participate in the Community if you are under 18. You will be redirected to the Lucid or airfocus app to log in.