Looking for a way to auto-number the steps in your flowchart? Check out this post on how you can utilize conditional formatting and formulas to accomplish this!
Please use the steps below to accomplish this on your diagram.
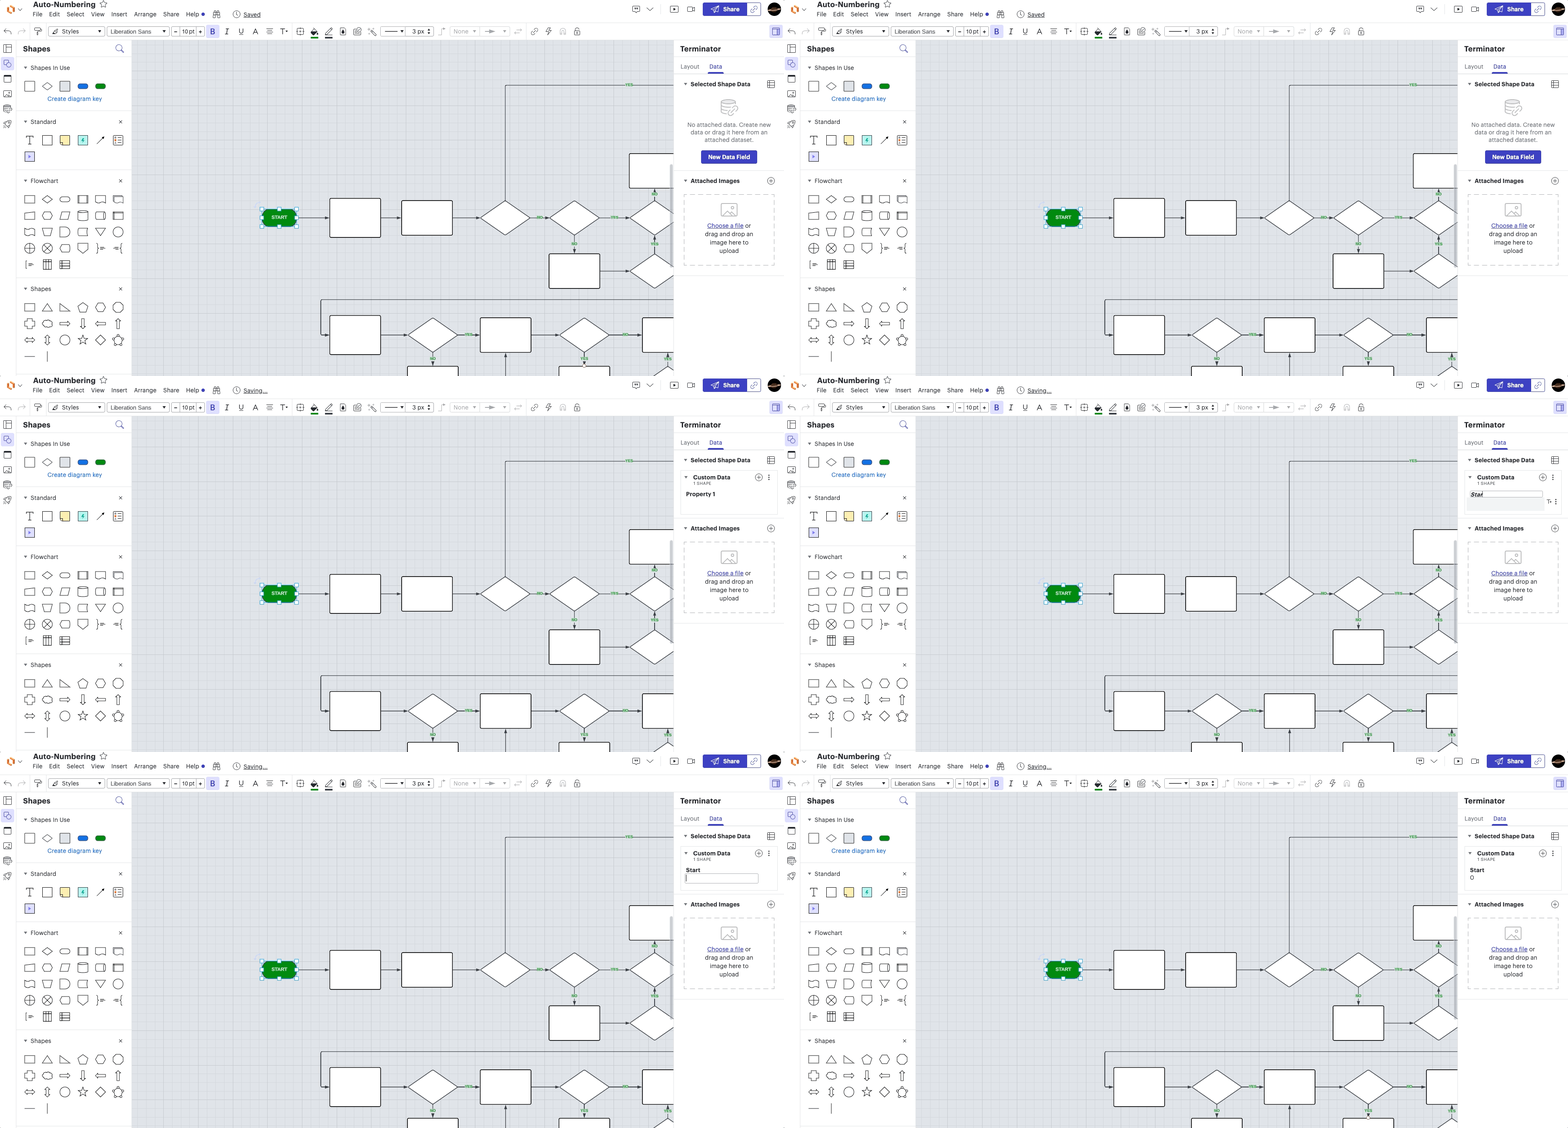
1. Add shape data "Start" to a start node with the value 0. This allows shapes connected to it to know it's part of the flow chart (as opposed to the note).
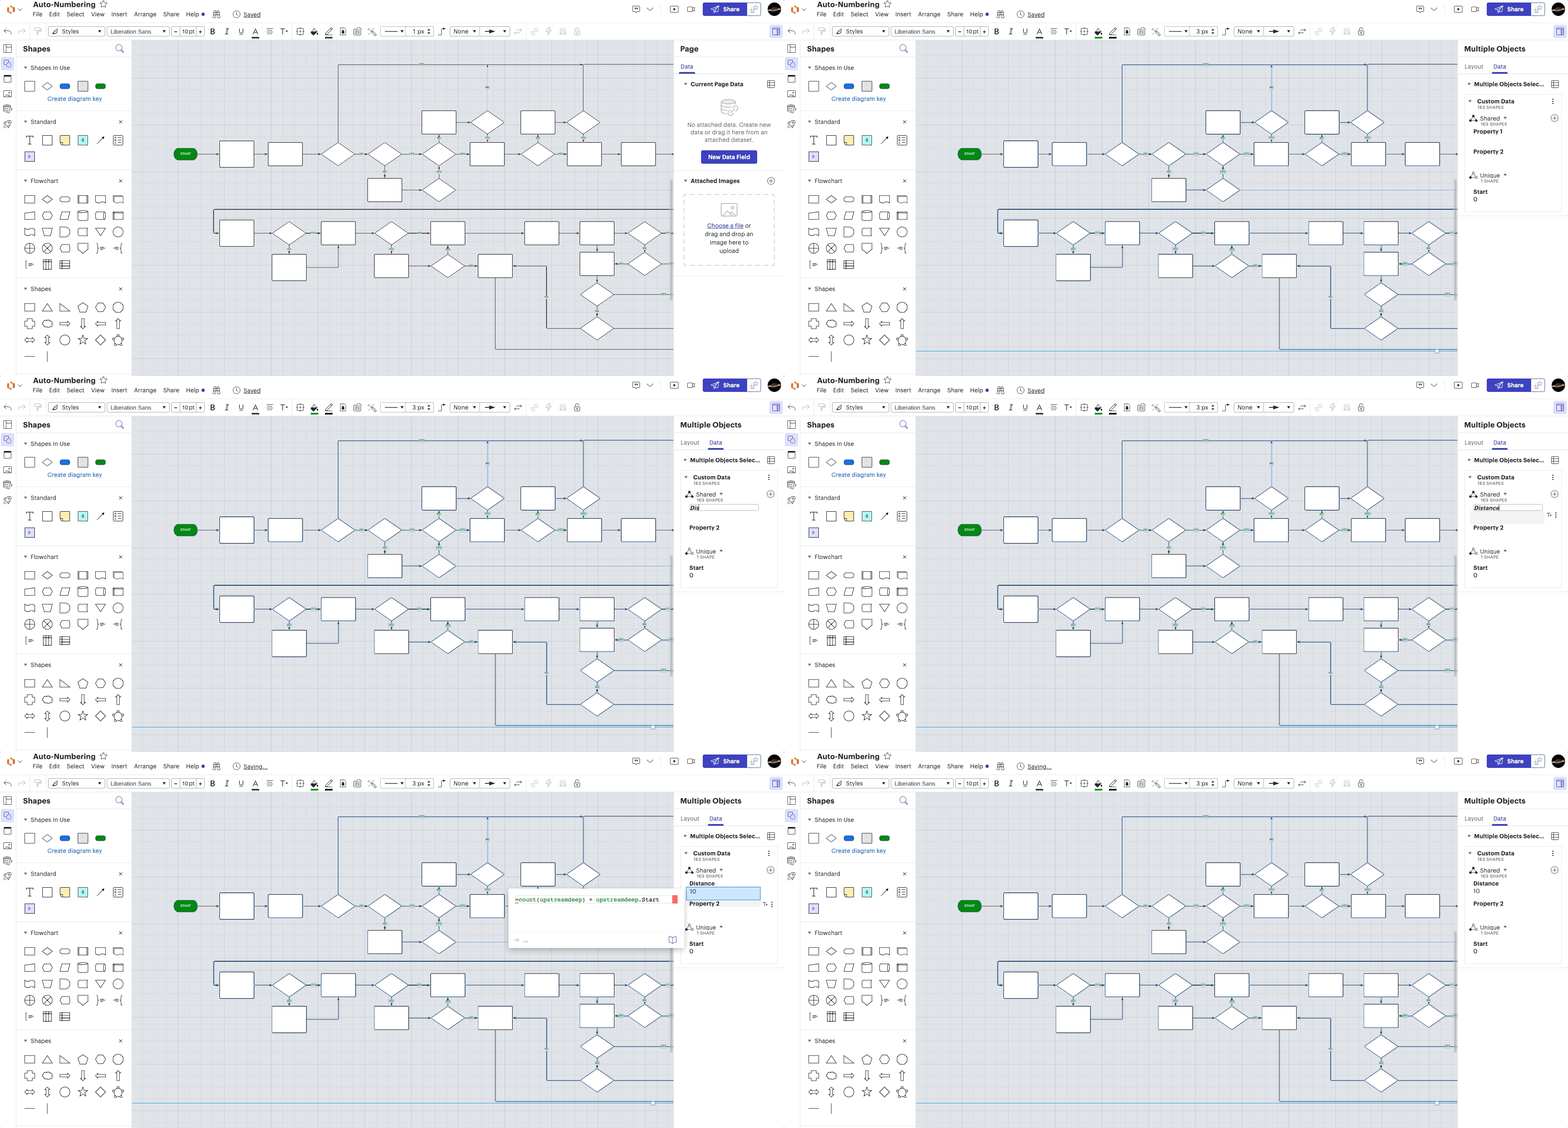
2. Add data "Distance" to all of the shapes with the formula =count(upstreamdeep) + upstreamdeep.Start. This will be defined with the distance from start or error (if the shape is not in the flow chart).
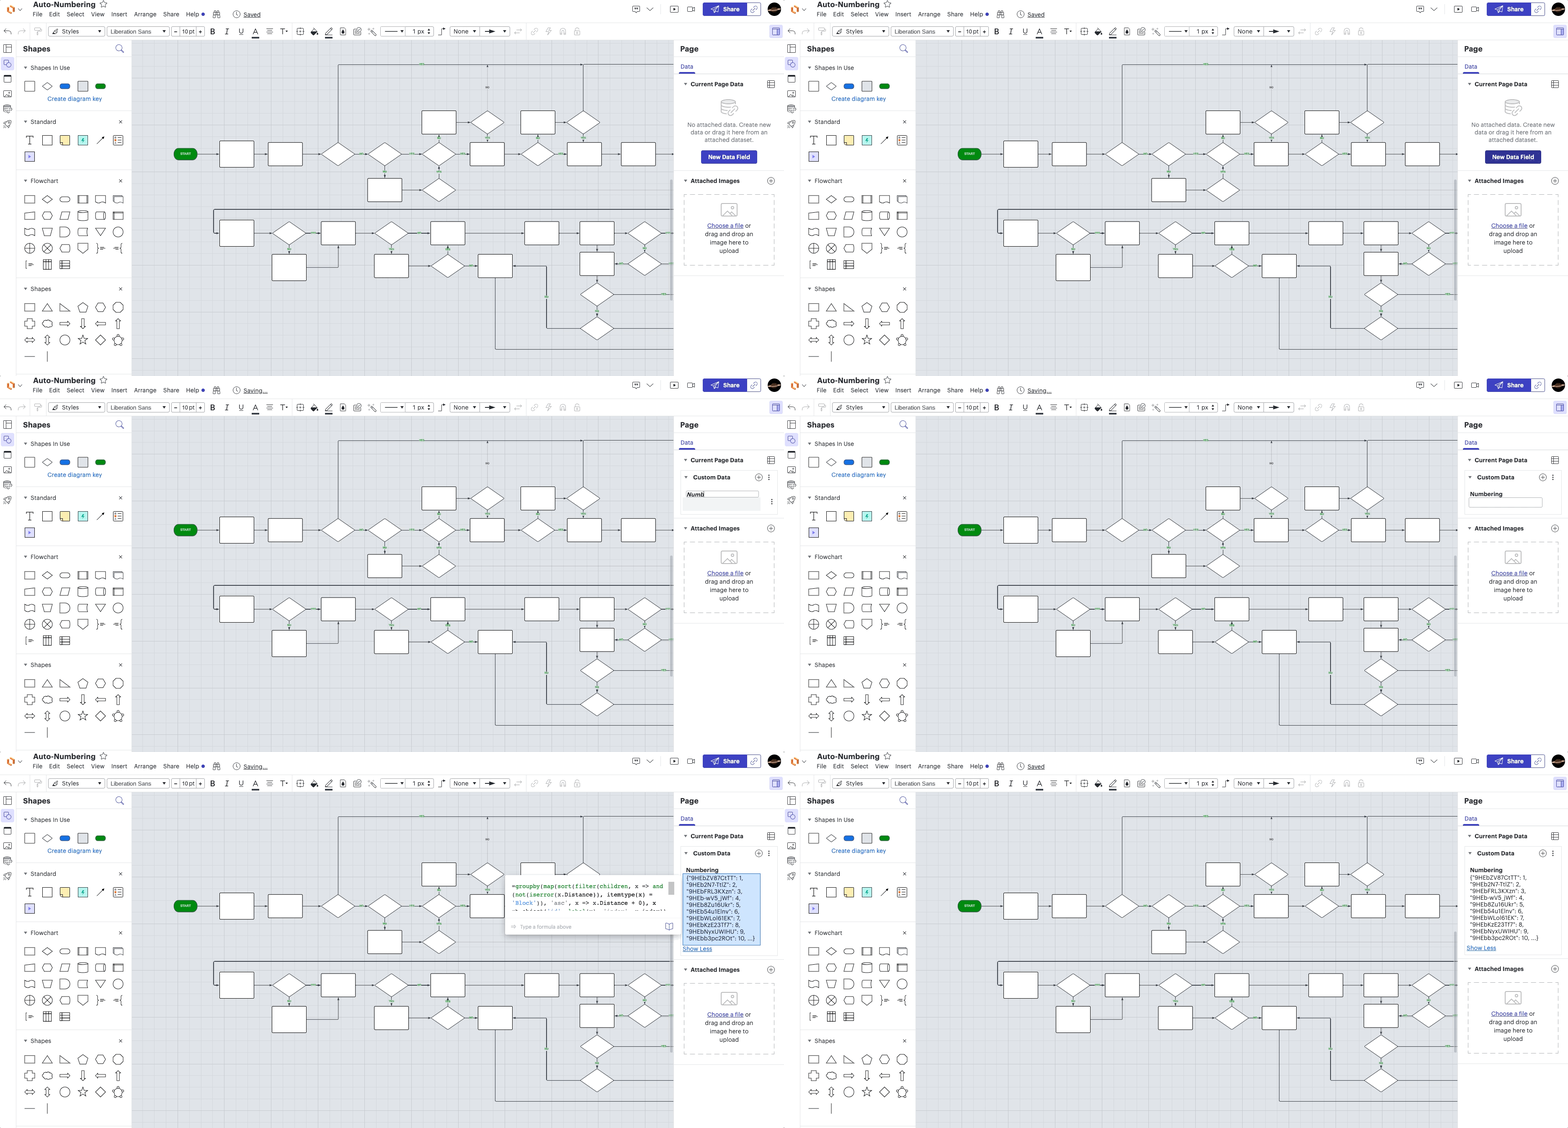
3. Add page data "Numbering" with the formula
=groupby(map(sort(filter(children, x => and(not(iserror(x.Distance)), itemtype(x) = 'Block')), 'asc', x => x.Distance + 0), x => object('id', label(x), 'index', x.index)), x => x.id, x => x.index)
. This formula sorts all blocks in the flow chart by distance and then groups them into an object where the key is the shape label (ID) and the value is the index returning in a mapping from block to unique numbering.
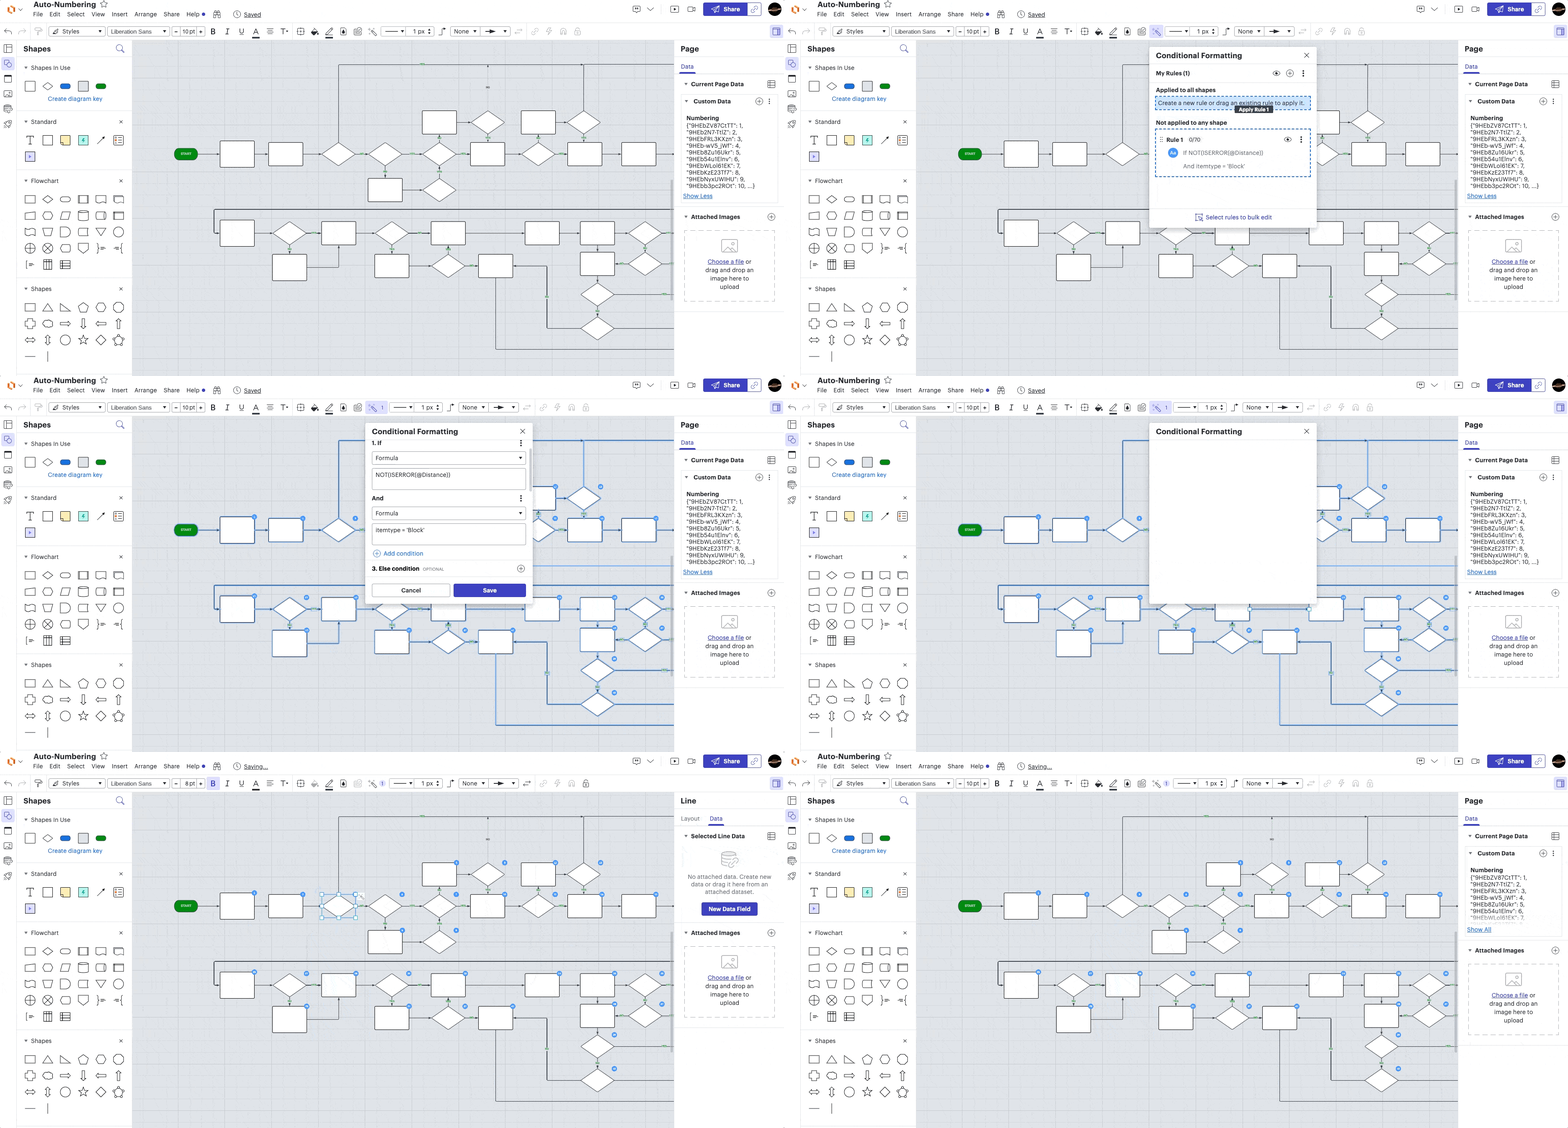
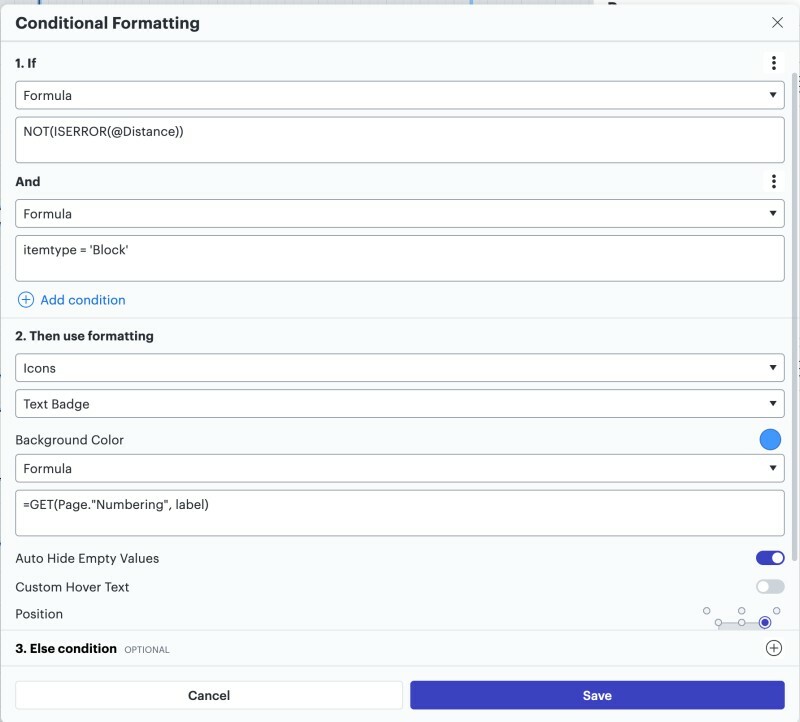
4. Lastly add a conditional formatting rule to add a badge when NOT(ISERROR(@Distance)) and itemtype = 'Block' (to prevent them from showing on lines) with the formula =GET(Page."Numbering", label) for the badge label. See screenshot for what the conditional formatting rule should look like (no else condition needed for this).
These steps will allow you to easily add and update step numbers to process flows while eliminating any duplicate numbers!
This is great I have been looking for a way todo this and this answered my question thanks! can it also be numbered by letters also like abc ?
Thanks for your response. Currently there is no way to label your flowchart using letters (a b c…). However we are always looking for ways to improve. Would you mind sharing your feedback or any clarifying details about what you'd like to use the letter numbering for? We greatly appreciate your feedback!
Welcome feature. Thank you. Would be even better if I can explode a shape to a new sibling chart and that sibling chart inherit the Distance value from its parent; then the shapes in the sibling would be e.g. If shape 3 was exploded to a new more detailed chart the sibling chart shapes would be numbered 3.1 3.2 3.3 etc.
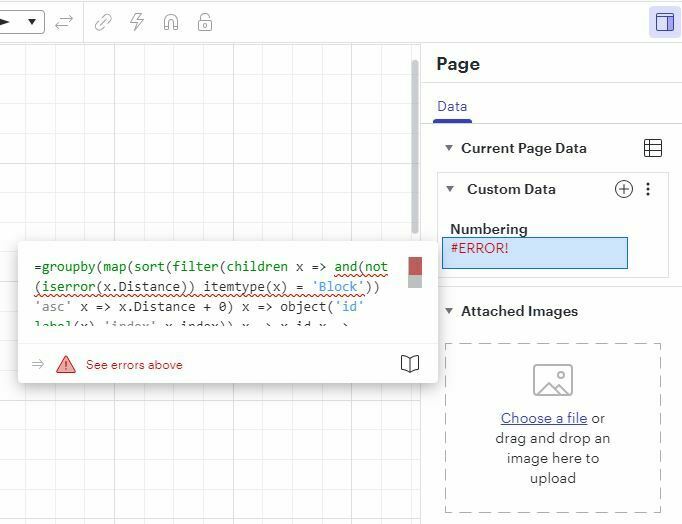
I get some sort of error though when creating the page data (step 3):
Wondering if you might have any ideas what I'm doing wrong, or if there's a better place to get at the elbow support on this? Thanks so much - this feature is a godsend.
It looks like there was an error in the original formatting of the formula in Step 3 that stripped out the commas. Here’s the corrected formula with the commas added in (the original post has been updated):
=groupby(map(sort(filter(children, x => and(not(iserror(x.Distance)), itemtype(x) = 'Block')), 'asc', x => x.Distance + 0), x => object('id', label(x), 'index', x.index)), x => x.id, x => x.index)
can it also be numbered by letters also like abc?
It is actually possible to number using letters instead of numbers, but the formula becomes slightly more complex.
In order to number by letter, we need to be able to convert the index (1, 2, 3, ...) into a letter. There are two formula functions we can use to do that, CODE and CHAR. Generically, the formula looks like this for a given number (with 1 => A, 2 => B, etc.):
char(code('A') + number - 1)
This only works with letters A through Z (numbers 1 through 26), however, so the formula gets slightly more complex to handle numbers above 26. In order to do that, we need to handle each digit separately. For values up to 702, using the following formula in place of Step 3 will work to number using letters (where they are lettered with A to Z, then AA to ZZ): =groupby(map(sort(filter(children, x => and(not(iserror(x.Distance)), itemtype(x) = 'Block')), 'asc', x => x.Distance + 0), x => object('id', label(x), 'index', if(x.index > 26, char(code('A') + floor((x.index - 1) / 26) - 1) & char(code('A') + mod(x.index - 1, 26)), char(code('A') + x.index - 1)))), x => x.id, x => x.index)
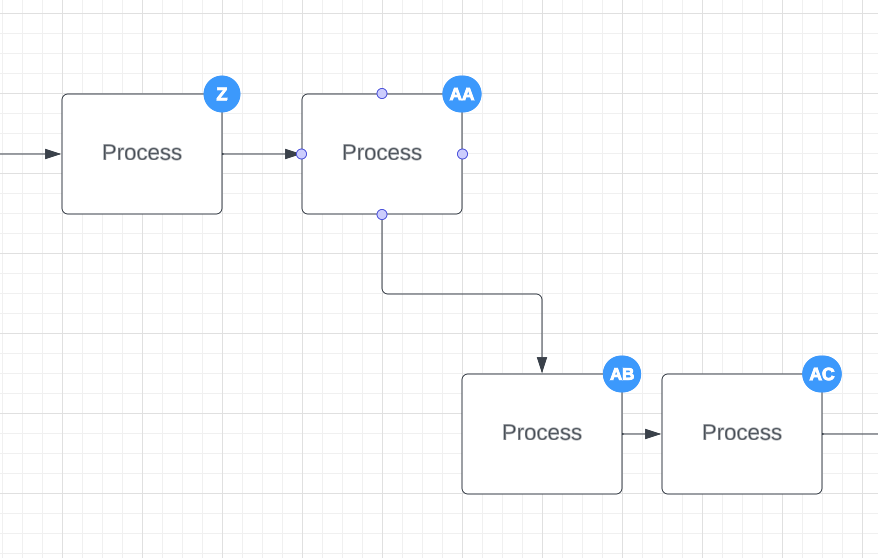
This results in this numbering, which is valid for up to 702 shapes (ZZ):
Beyond 702, the formula becomes much more complex.
Are there any videos on this? I’m having some trouble with getting this to work.
@aaronpatkramer We don’t currently have any video tutorials on this, but we’re more than happy to take a look at what you’re seeing. Is there a particular question you have or step you’re having difficulty with?
Hi had an issue where some shapes weren’t included. Took me a while to figure out it was because i had originally drawn the arrows backwards and then reversed the arrow heads. When I deleted the lines and redrew them the correct way around first time, the numbers appeared
P.S. There’s a comma missing in the =GET(Page."Numbering" label) part of the post
@arhmcleod Thanks for sharing this insight with us - I’m glad that you were able to resolve it and get it to work!
And great catch - I’ve corrected this in the original post.
There seems to be a bug, where if I connect multiple lines to end at a single shape, something breaks and the number disappears.
My current workaround is for all arrows (except the first one) which terminate at a single shape is to draw them to finish just short of touching the shape. Again this seems to work, but its not great because if you look closely there’s a small gap. Not a big deal, but curious if anyone knows a better fix?
With multiple lines connecting into a shape, the value for upstreamdeep.Start returns multiple values, which causes the formula =count(upstreamdeep) + upstreamdeep.Start to fail.
A workaround would be to choose the first upstreamdeep.Start value (from the original post, there should only be a single shape with a Start value). To do this, change the Distance formula to:
It is actually possible to number using letters instead of numbers, but the formula becomes slightly more complex.
In order to number by letter, we need to be able to convert the index (1, 2, 3, ...) into a letter. There are two formula functions we can use to do that, CODE and CHAR. Generically, the formula looks like this for a given number (with 1 => A, 2 => B, etc.):
char(code('A') + number - 1)
This only works with letters A through Z (numbers 1 through 26), however, so the formula gets slightly more complex to handle numbers above 26. In order to do that, we need to handle each digit separately. For values up to 702, using the following formula in place of Step 3 will work to number using letters (where they are lettered with A to Z, then AA to ZZ): =groupby(map(sort(filter(children, x => and(not(iserror(x.Distance)), itemtype(x) = 'Block')), 'asc', x => x.Distance + 0), x => object('id', label(x), 'index', if(x.index > 26, char(code('A') + floor((x.index - 1) / 26) - 1) & char(code('A') + mod(x.index - 1, 26)), char(code('A') + x.index - 1)))), x => x.id, x => x.index)
This results in this numbering, which is valid for up to 702 shapes (ZZ):
Beyond 702, the formula becomes much more complex.
Is there a way to use decimals? (example 1.1, 1.2, 1.3?)
Hi @Hbusey, thanks for continuing this thread! To clarify, would all steps in your flowchart begin with a “1”, or would your process at some point shift to 2’s (2.1, 2.2, 2.3...), 3’s (3.1, 3.2, 3.3...) and so on?
If it would be possible to have the option to shift to 2’s and 3’s that would be amazing! The use case is that we have process maps where the high level process is 3.0 and then steps within that process are 3.1, 3.2, 3.3, etc. Is that possible?
I see, thank you! The difficult aspect here is converting the index of the shape into the desired sub-step label, in the same way in the example above we had to convert the index of the shape into a letter, as well as telling Lucidchart at which point steps shift to 2’s and 3’s. I’ll tag in @geoffmaddox and @khaleesioflucidchart as formula pros for their insight here.
This is a super-helpful resource, and will replace time-consuming manual numbering! I’m wondering if it’s possible/how to eliminate specific shape types from the numbering process, so that for example, only Process shapes are numbered, and everything else (flow switches, terminators, etc.) are not. Do you have any suggestions on how to edit the formulas here to do so?
Awesome workaround! thanks for the post!
Q: How do you export those custom numbers to the googlesheet? and how do you adjust the formatting? Such as font of the font, color, border etc from the text badge?
Thanks!
Hi @z.reiser, apologies for the delayed response here! The original formula builds a mapping of the shape to it's index (as defined by the ordering), so the mapping could be updated to first filter to a particular shape type.
Could you please try something like the following, where ShapeTypeHere is the specific type of block to filter by?
=groupby(map(sort(filter(children, x => and(not(iserror(x.Distance)), itemtype(x) = 'Block', shapetype(x) = 'ShapeTypeHere')), 'asc', x => x.Distance + 0), x => object('id', label(x), 'index', x.index)), x => x.id, x => x.index)
@ChiliC Thanks for your questions!
Regarding export - to clarify, is your ultimate goal to have a spreadsheet with a column containing the step and another column containing the step number?
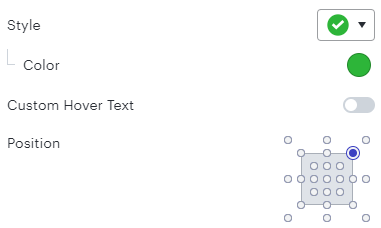
Regarding changing the formatting - currently, Lucidchart supports editing the following fields for a badge applied via conditional formatting: style, color, custom hover text, and position.
These are all available within the conditional formatting menu when creating the “then” part of the rule. If you’d like to see additional attributes, like font and border options, available here, we would love to hear more! We’re very interested in your feedback and committed to continually improving our products. Please first search the Product Feedback section of this community (with the filter Topic Type = Idea) to see if it’s already been submitted. If so, please add any additional details you’d like and upvote the request - this consolidation helps to refine feedback and properly capture the popularity of the request.
If no one has submitted this idea yet, please create one of your own and be sure to include details about your use case or what you’d like to see in this experience. This will also allow other users with similar requests to discover and upvote it, then add details of their own.
Finally, for more information on how Lucid manages feedback via this community, take a look at this post:
@Micah
Thank you so much for your quick response. This is amazing to have such a great product support. Definitely very encouraged on continuing using Lucid Suite for our daily work!
“Regarding export - to clarify, is your ultimate goal to have a spreadsheet with a column containing the step and another column containing the step number?”
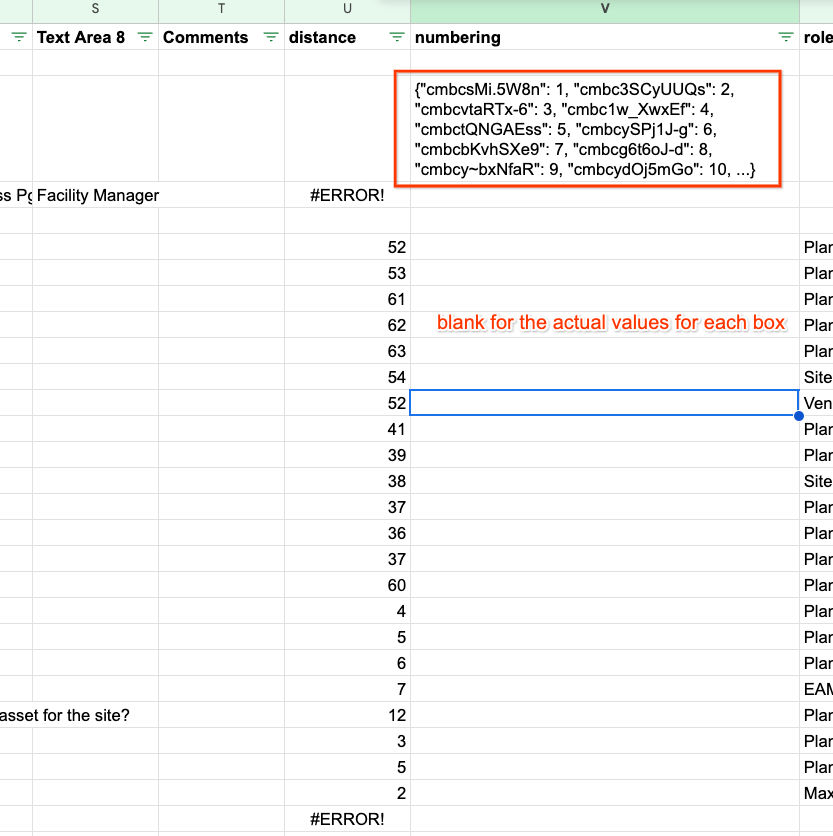
Yes, I’m trying to export all these steps (numbers) into our process document narrative. Given that the process mapping is a dynamic field (the process mapping continuously being worked, I want to a quick way to update our documentation for the reference of these step numbers.) Currently - the numbering custom field is only showing the formula unique strings…
@ChiliC Thanks for your response - very happy to be collaborating with you in our community! Can you clarify how you’ve generated the spreadsheet above in your screenshot?
@Micah My Spreadsheet is an export from the lucidchart. (CSV and I converted to Googlesheet)
A follow up question, if from the “Start” shape, i have multiple lines, how do i choose which line is the numbered with “1”
Hi @ChiliC, thanks for getting back to me with this additional detail.
Regarding the spreadsheet - it unfortunately isn’t currently possible to have Lucidchart arrange the export in this sort of way based on the logic of your diagram automatically, nor can you specify the arrangement manually. Right now, it’s ordered by the internal ID of the object, but I certainly understand how this sort of ability would be a helpful addition to this feature. We’d be grateful to hear more feedback on this.
Please first search the Product Feedback section of this community (with the filter Topic Type = Idea) to see if it’s already been submitted. If so, please add any additional details you’d like and upvote the request - this consolidation helps to refine feedback and properly capture the popularity of the request.
If no one has submitted this idea yet, please create one of your own and be sure to include details about your use case or what you’d like to see in this experience. This will also allow other users with similar requests to discover and upvote it, then add details of their own.
Finally, for more information on how Lucid manages feedback via this community, take a look at this post:
Regarding your follow-up question about choosing which line is “1” - do you mean within the diagram itself via the conditional formatting and formulas (which ideally would then be reflected in the exported data?)
Reply
Create an account in the community
A Lucid account is required to interact with the community. You will be redirected to the Lucid app to create an account.