i have been using Lucid AI to create simple class diagrams from CSV structured data. said data is structured as:
Index,SourceSystem,Direction,Data,TargetSystem
ID01,FI,Inbound,SomeKindaDATA,BRIDGE
ID02,FI,Inbound,OtherKindaDATA,PATE …
The result would be:
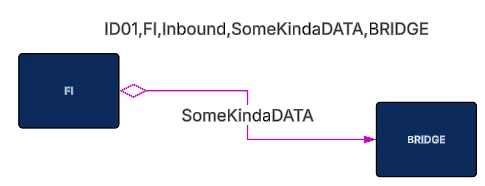
the above data source has 293 rows, pasted into the canvas as a CSV data source
it is processing 10 rows at a time. The prompt is as follows:
you are an expert in infrastructure diagramming using simple class diagramming techniques
you will be creating a systems diagram with relationships
it will be structure like a mind map with XXXX in the middle, and outlying systems as leaf nodes
you will use the following CSV data source table on the lucid canvas pasted into the lucidchart document
has the following column meanings:
    Index - unique relationship id
    SourceSystem - is a system
    Direction - is the direction of the relationship:
        - Inbound = TargetSystem is from end, and SourceSystem is the to end of the relationship
        - Outbound = SourceSystem is from end, and TargetSystem is the to of end the relationship
    Data - is the transactional data on the relationship sent from between TargetSystem and SourceSystem
    TargetSystem - is a system
create a basic system model using boxes for systems and lines for relationships
colorize each system based on:
    - SourceSystem = DARK GREEN line
    - TargetSystem = DARK BLUE line
use a small diamond arrowhead for the FROM end of the relationship
use a closed arrowhead for the TO end of the relationship
Make the layout to be export friendly to reduce crossing lines
Make all lines where the FROM system is the SourceSystem color MAGENTA
Make all lines where the FROM system is the TargetSystem color GREEN
each iteration is initated:
>draw all systems and interconnecting relationships from RelationshipID equals ID01 through ID10
this worked until ID40 then it began to error
QQ: are there any recommendations to get this to work?
Thanks