Describe why you built it and how you use it in your role/industry
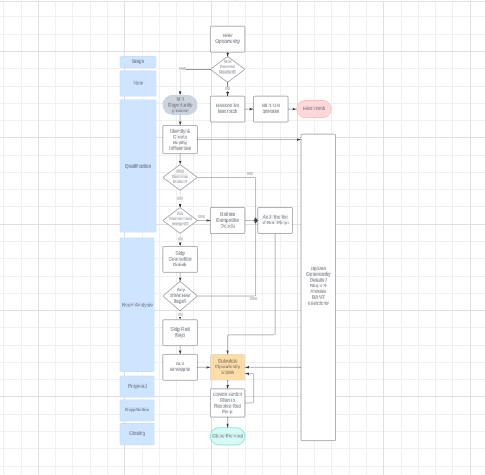
This lead management scenario involves a centralized system interacting with multiple upstream and downstream systems. Showing how all of these complex systems interact in Lucidchart is really helpful.
A lead management system has several moving parts, including customer leads, lead sources, lead status, enrichment services, and CRM systems.
- Leads represent potential customers and their information.
- Lead sources are channels where leads originate, such as website forms or social media ads.
- Lead status is the current stage of a lead in the sales funnel.
- Enrichment services are external systems that enhance lead data.
- CRM system is where qualified leads are transferred for further nurturing and sales activities.
My diagram of this scenario needs to model lead intake, lead qualification, lead enrichment, lead routing, and error handling. It should visualize the data flow from lead sources to the central system, through lead qualification and enrichment, and finally to the CRM system, including error handling paths and data stores for leads and enrichment data.
Additionally, I’ve included security measures and a feedback loop to improve lead qualification and enrichment processes.
Creating this design in Lucidchart allows me to effectively visualize and manage the complex lead management scenario.
What Lucid features did you use to build your board that were especially useful?
In my Lucidchart diagram, I utilized various visual elements to effectively represent the complex elements of lead management. For example, I used shapes, such as rectangles for entities (Leads, Services), and diamonds for decisions (Qualification) to help distinguish between different components. I also used connectors to clearly illustrate the data flow between elements, providing a clear understanding of the process.
To enhance organization and clarity, I employed containers and groups to categorize related elements, such as grouping Enrichment Services (downstream) together. Additionally, I leveraged data linking to connect lead data between processes, allowing for seamless visualization of data flow.
I also used several layers in my diagram to separate different stages, such as intake and qualification, for improved organization. Additionally, I created custom symbols and icons to represent Lead Sources and specific Enrichment Services which enhanced the visual representation of the system.
These design elements collectively contributed to a comprehensive and intuitive representation of the lead management process.
What would you recommend to another user looking to do something similar?
To effectively design a lead management system in Lucidchart, it's essential to start with a solid understanding of the moving parts by identifying key entities and processes in your system. Clearly define all entities involved, such as Leads, Sources, Statuses, Services, and CRM. Then, outline the key processes, including Intake, Qualification, Enrichment, and Routing.
Some of my recommendations for effective diagramming are:
- Embrace the power of flowcharts and shapes to visually represent the data flow, using standard shapes like rectangles for entities, diamonds for decisions, and arrows for connections.
- Leverage organizational features like containers and groups to categorize related elements
- Consider using layers to separate different stages of the lead journey, this can improve readability.
- Enhance clarity with visuals by incorporating custom symbols or icons to represent specific Lead Sources or Enrichment Services.
- Use data linking to visually connect lead data points across the system
- Remember to prioritize user-friendliness with clear labels and annotations and consider strategic color coding to improve visual distinction.
By following these recommendations, you can create a comprehensive and easily understood lead management system in Lucidchart.