
I recently had a conversation with someone who said they had seen me build an agile calculator as a part of the Lucid Formula training and was frustrated because they thought it was really cool but felt I went too fast and relied on the previous videos too much.
This step by step guide will hopefully rectify that and help you build your own capacity calculator in Lucid. You can imagine this as a “Lucid Recipe”, so let’ start cooking!
I created this practice board with the same instructions you are welcome to follow along on, it has the same instructions but is in a Lucid document, when you click the link above it will automatically make a new copy for you of the practice board.
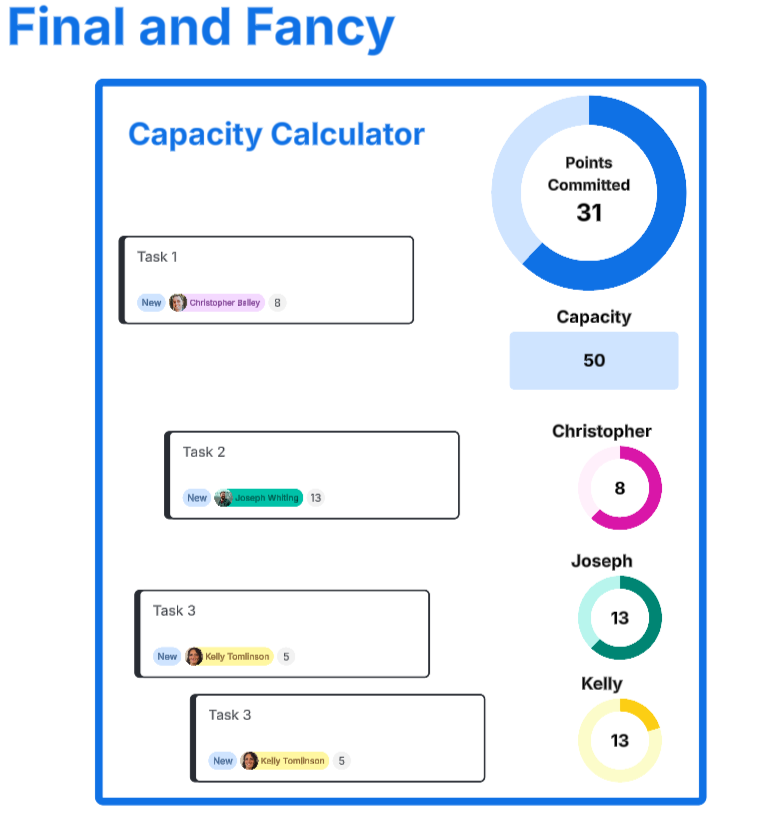
Capacity Calculator
Time to build: 30 minutes (for a beginner)
What you’ll need:
- A Lucid Licenses (this will work best with a Lucid enterprise license where you have access to both Lucidchart and Lucidspark) but you can do it with a free lucidchart license, it just requires some substitutions.
Inside of Lucid you’ll need:- Lucid Cards (connected with your favorite card integration, you might use Jira or ADO, I’m going to be using Airfocus for this guide)
- A Container Shape
- A Dynamic Shape
- A Regular Rectangle Shape
- I also recommend this Lucid Formula training
Part 1 - Set up your container:
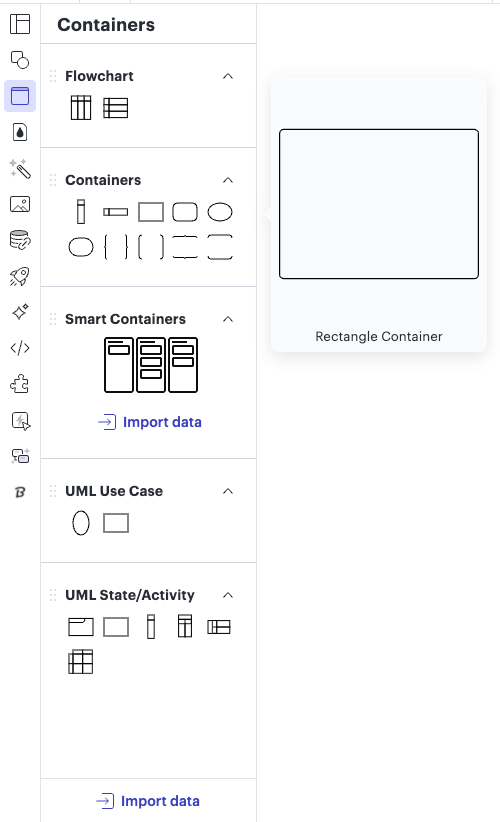
This is where I see the most hangup in building a containment calculator. In Lucid we have thousands and thousands of shapes, however only container shapes can do containment formulas. In Lucidchart any shape in the left hand container panel will be able to use a container formula. For this guide I will be using the “Rectangle Container” found in the container panel.
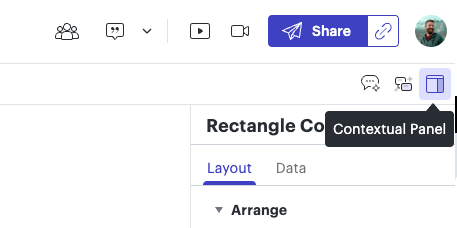
- Once you have your container of choice go to the far right side of the canvas and click on the contextual data panel (the icon is the top right near the share button)
- Below the shape name (Rectangle container) you’ll see the words “Layout” and “Data”, select data.
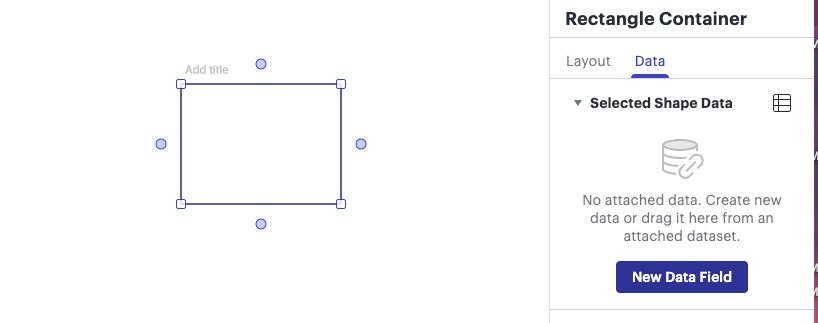
- Select “New Data Field”, then name the field “Total Points” (you can name this something else but the guide will use the names I call out here)
- In the field below “Total Points” we will add our first formula! Add this formula: =sum(contained.$estimate)
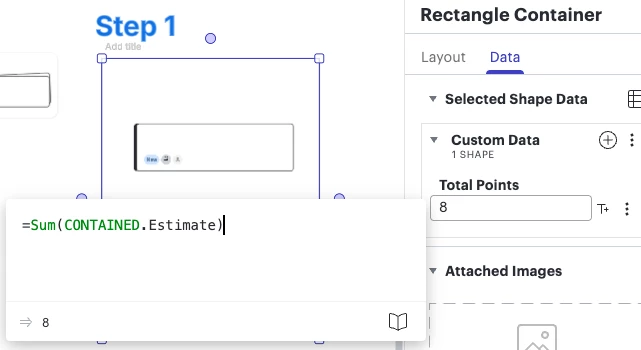
Evaluating this formula:
= - This tells the field that it is going to be a formula
Sum () - Just like Excel this formula sums all the items inside the parentheses
Contained.$estimate - This tells the container to search the shapes inside of its borders and bring back everything that has an “Estimate” Field.
- Now we can add a Lucid card to the container, add a number the “Estimate” field on the card and if we go back to the “Total Points” field in the container we should see the number from the card in the container. If we add some more cards with numbers we should see this number summed in the container field. There you go, that’s the hard part!
Part 2 - Adding a counter
- Now that we have the data in the container all we have to do is make it a little bit more visible. Start by taking a text box from your left hand panel and make sure that all four corners are inside the container we made in part 1.
- On the face off the card add the following formula, you must add the curly brackets at the beginning and end of the formula for this to work:
{{=containedby.”Total Points”}}
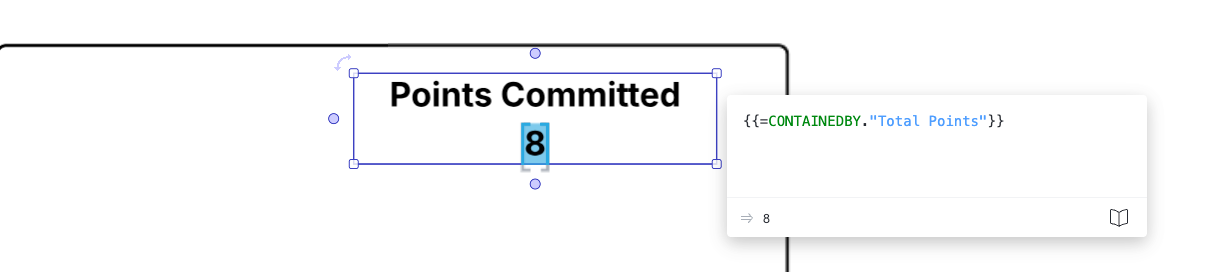
Evaluating this formula:
{{ }} - These curly brackets allow us to add formula results in text areas on the canvas
= - Once again this tells Lucid you want to create a formula
containedby.”Total Points” - this tells the text box you are putting this into to search for any containers it might be inside of and then if that container has a field called “Total Points” then it should return that to the face of the text box.
There you go! Now you have a container that sums all the estimates you add to it and you can see that number go up without going to the contextual panel, but what if you want to add a pie chart or line bar?
Part 3 - Adding dynamic shapes (Pie chart)
- Go to the bottom left hand corner in Lucidchart and select “More shapes” from the library on the left, find the “Dynamic shapes” library and make sure it is checked. You can then exit the modal and start building
- Select the dynamic shape you would like to use, I’ll be using a pie chart but you are welcome to use the bar or pill shapes, the process will be the same. Add it to the container and make sure it is completely inside the container shape.
- Go into the contextual panel like we did in Part 1 and make sure you are in the data section. You should see fields there already for “Max”, “Value”, and Min”. In the value field add the following formula (it should look familiar):
=containedby.”Total Points”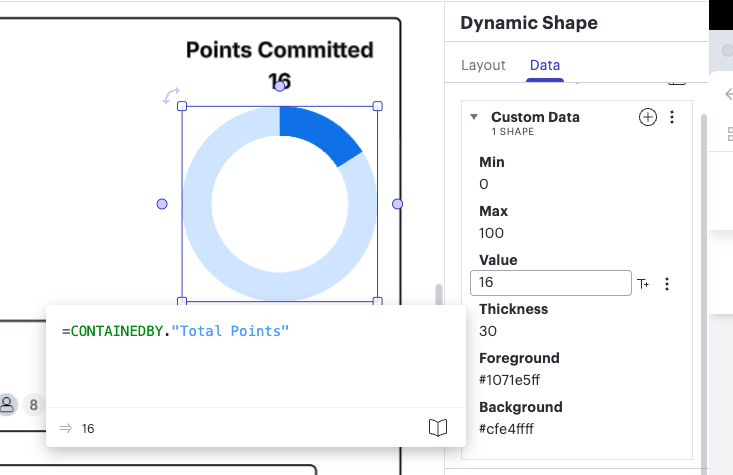
- This will mean the sum of all the estimates on the cards will now be the moving field, as you add more cards you should see the bar move up. As you take cards out of the box the bar should move down.
- Note: Value is the shifting variable in this shape and the thing you want to change, you can think of it at the numerator.
Max: is the denominator, if the value is higher the max the shape will be completely full. So you will want to set your Max to something big enough that the value will be less then it (example, if my teams velocity is 50 then I will want to set my “Max” field to 50. In the next step we will add an input box for this field)
Part 4 - Adding an Input Box
We are almost there! While your calculator should be working this last step should make it easier for you to change the denominator field without having to go into the contextual panel.
- Add a regular rectangle shape to the container, make sure the entire shape is inside the container from Part 1. The formula will not work if it is not.
- Go to the contextual data panel, add a new data field, call it “Capacity Input” (or whatever you’d like to call it) and add this formula in the space below the name:
=this*1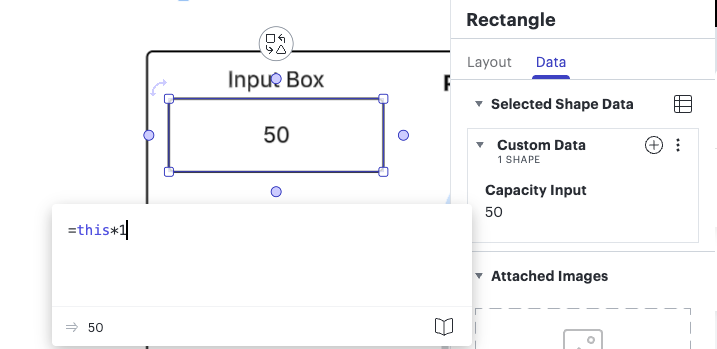
Evaluating this formula:
= - Tells Lucid this is a formula
This - Tells Lucid to take whatever is written on the face of this shape and put it in this field (Capacity Input).
*1 - This multiplies the answer by 1, it’s a simple trick to ensure that Lucid knows the answer is a number.
- Add a number to the rectangle you’ve made into your Capacity Input
- Go to the container and add a new field call it “Total Capacity” and add the following formula:
=CONTAINED."Capacity Input"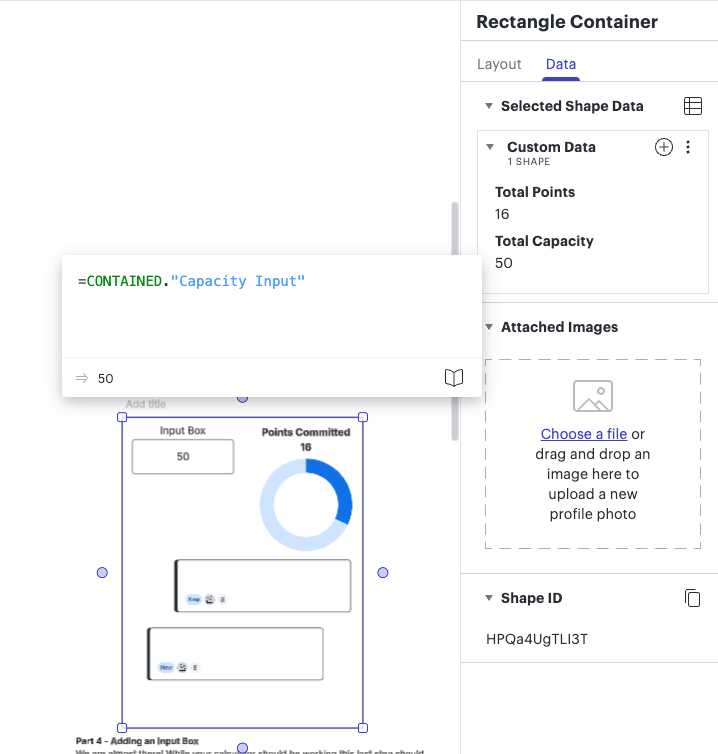
- Go to your dynamic shape from step 4 (In my case a donut chart) and add the following field the Max Value:
=CONTAINEDBY."Total Capacity"
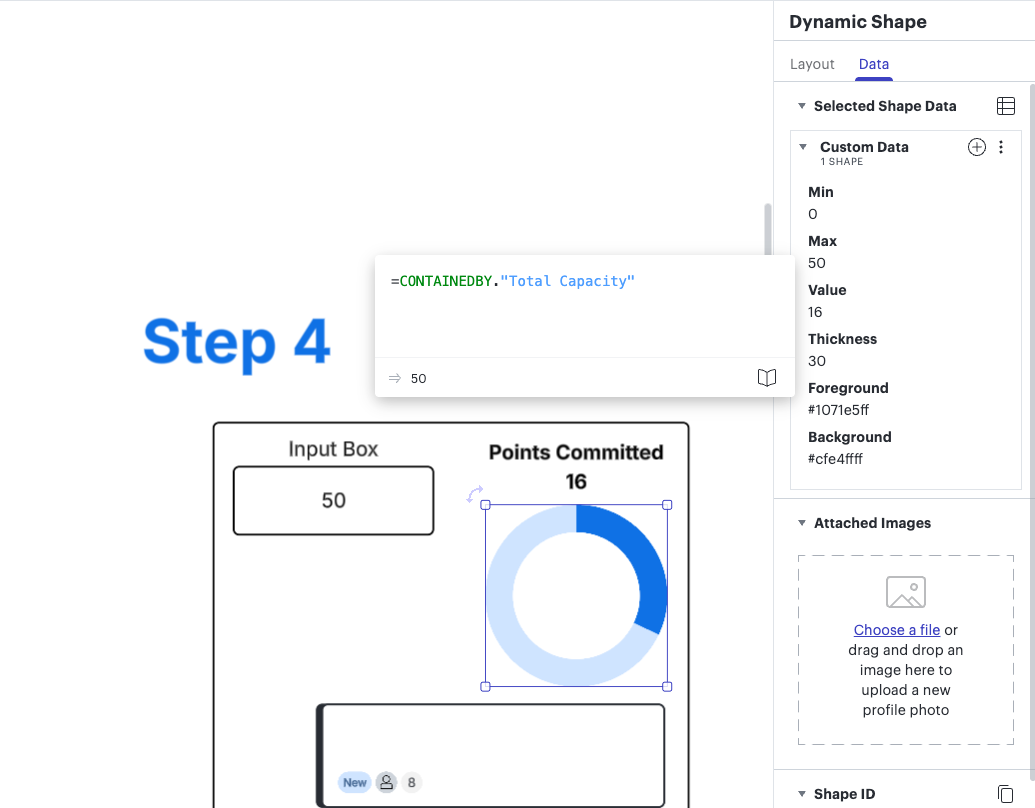
And there you have it! Your capacity calculator with an input box is complete, you can format it and additional changes to further customize it. Additionally you could add filters to break down how much each team member has taken on in addition to the total sum!

