
Is anybody doing more designerly diagrams in Lucidchart?

  • January 15, 2026
  • 4 replies
  • 27 views

Zoe H102
Forum|alt.badge.img+4

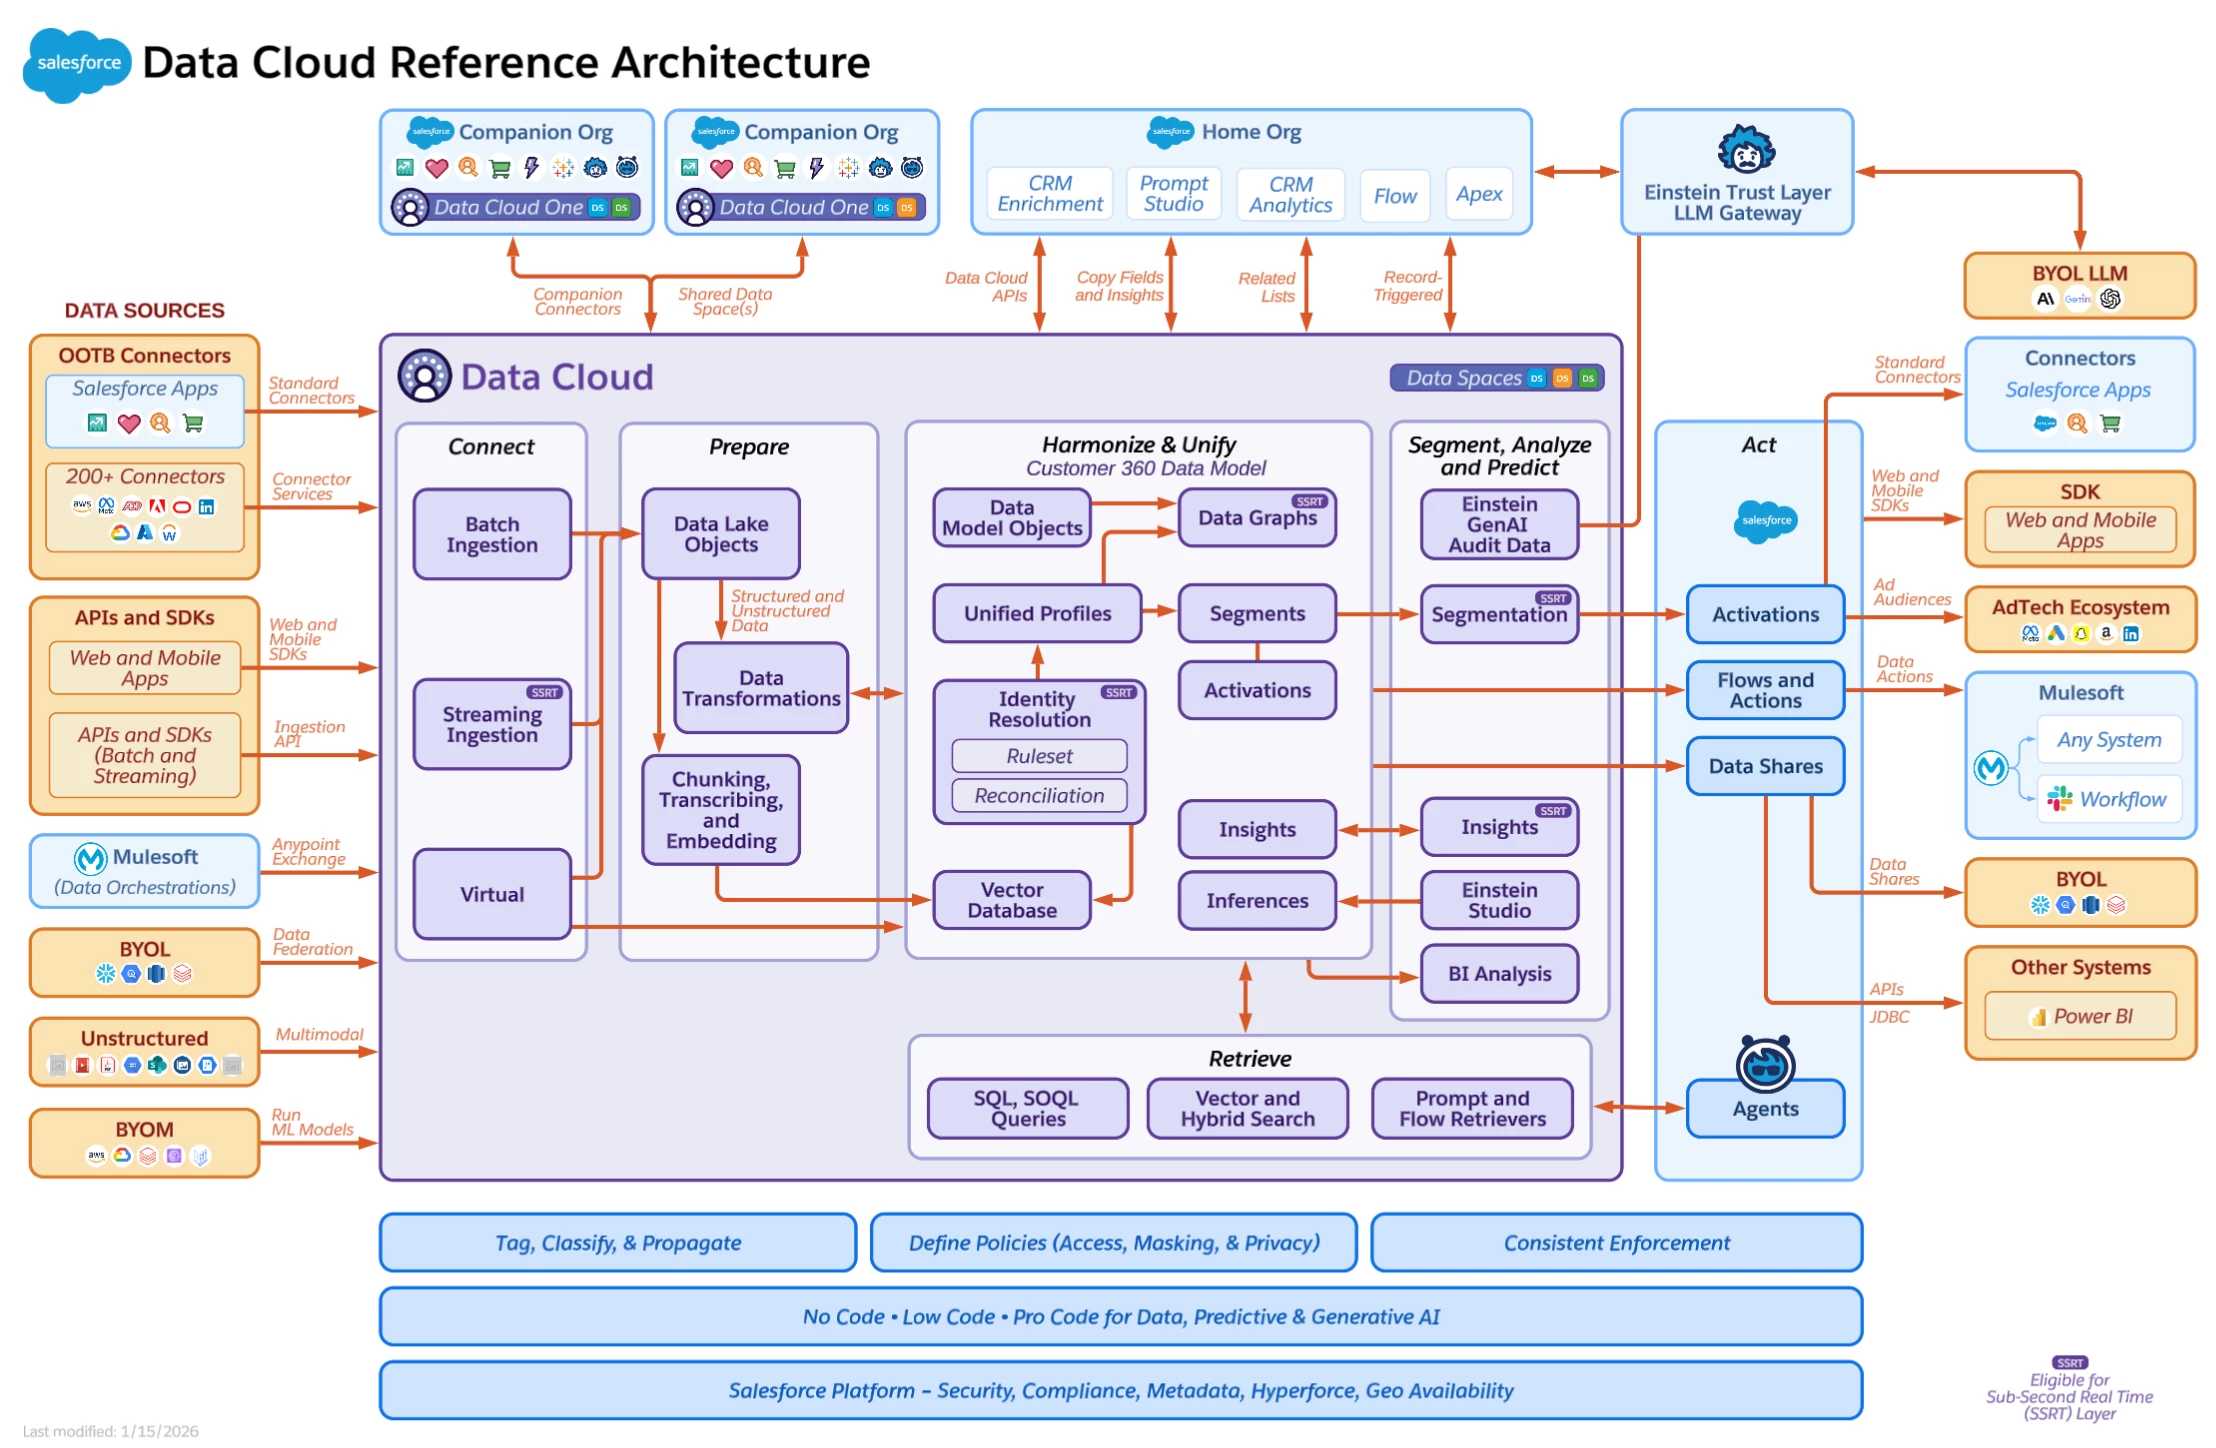
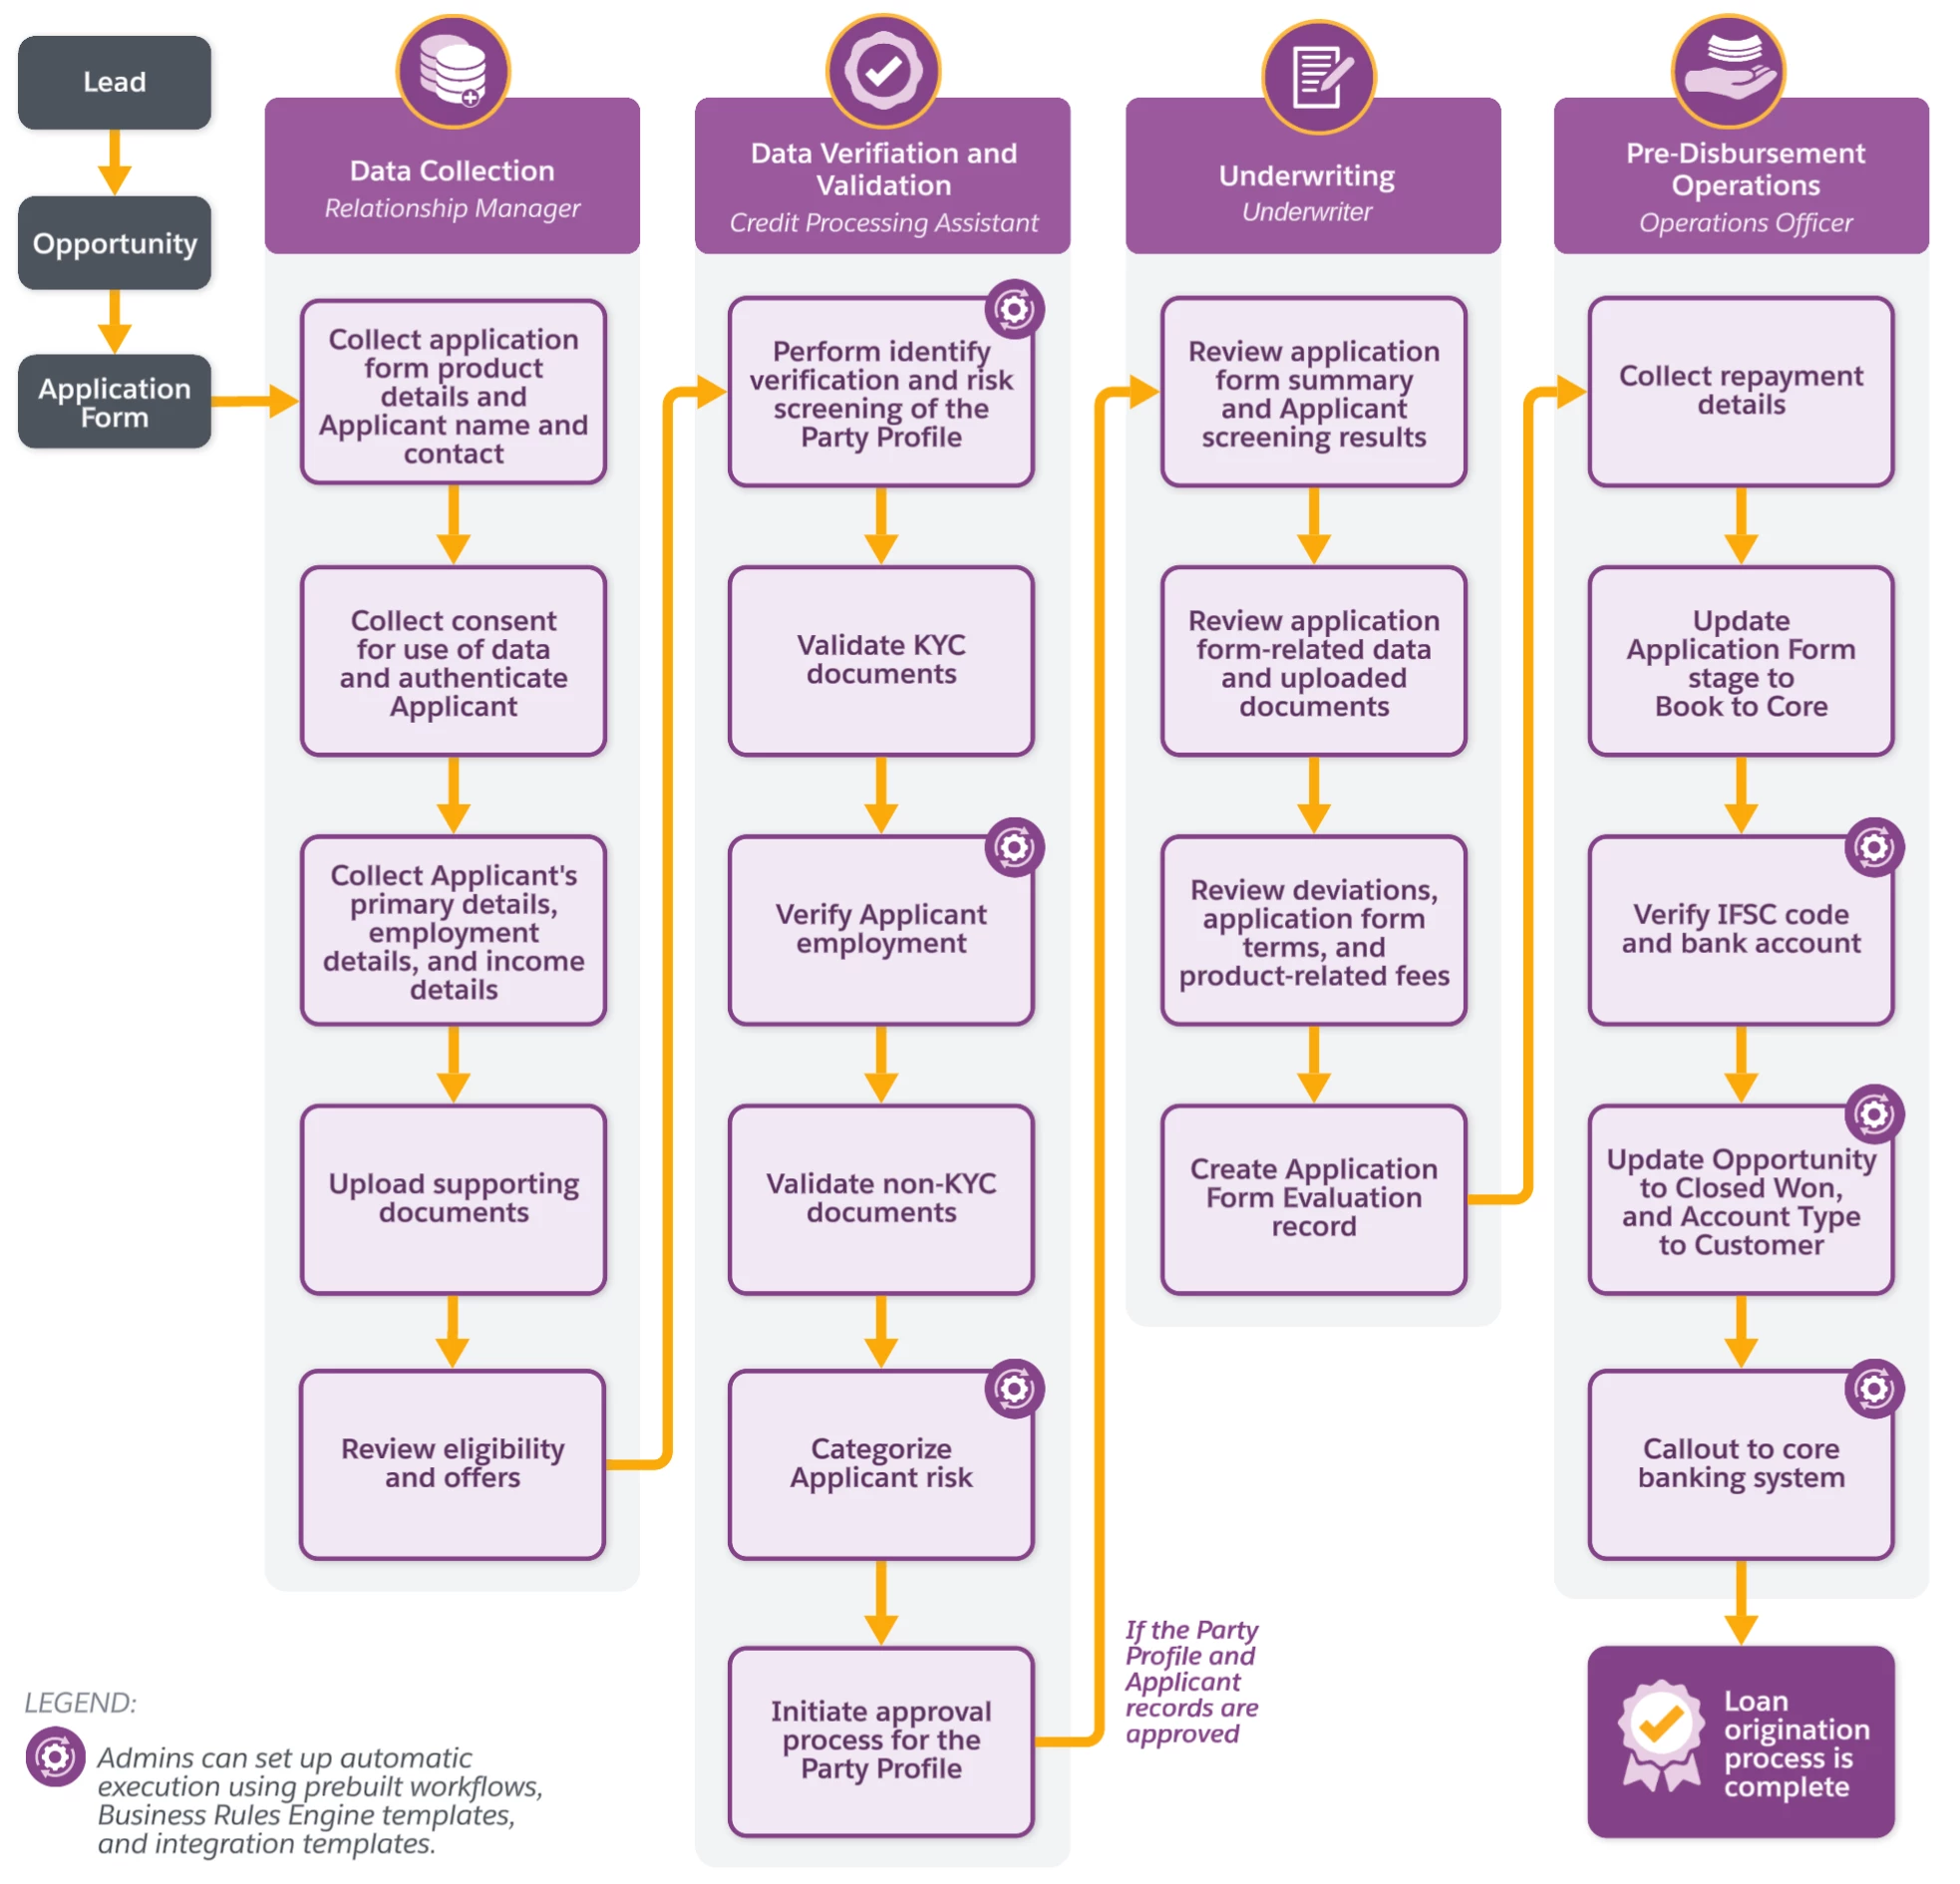
Hi – I design diagrams for Salesforce’s documentation. We have put a lot of effort into coming up with a branded style that includes using our products’ defined colors, clean organization and focused grid structure. Trying to visually simplify what can be very complex topics, while also making them look nice. I am not seeing any posts in these forums that specifically relate to the graphic design/information design aspect of using Lucidchart. There must be others out there who are doing similar things though – and if any of you happen to see this post, I’d love to have a thread here that shared some Lucidchart design inspo! (And perhaps there are forums elsewhere that share those types of things?) Here are a few diagrams I’ve done for our documentation, to get the ball rolling:


Comments

Zuzia S
Forum|alt.badge.img+8
  • Lucid community team
  • January 16, 2026

Hi ​@Zoe H102, thank you for posting in the Lucid Community! 

There are a few resources that I believe would be helpful: 

I hope these are helpful! Please let us know if you have any additional questions or thoughts to share.

Cheers!


Zoe H102
Forum|alt.badge.img+4
  • Author
  • January 27, 2026

Hi ​@Zuzia S – thanks for your response. I’m not looking for assistance in designing diagrams (and I actually have been part of the teams designing those Salesforce shapes – and all of those Salesforce data model templates in your system were designed by me!) – however I was hoping to start a thread here to talk about the graphic design and visual aesthetics angle of diagram design… using branding and shapes/colors to create beautiful easy-to-read diagrams. I know Lucidchart excels at the concept of diagram creation in general – but the defaults are often more utilitarian, and I’m curious about others who like me, in the course of our work, go the extra mile to brand our diagrams visually and give them a designerly touch.  😊 More of a community graphic design thread than a how-to-make-diagrams thread.


  • January 28, 2026

Love these thanks for sharing your work. I’ve also used Lucidchart extensively for diagrams focused on flow and circulation, especially when trying to simplify complex systems into something clean and readable.

I’ve found the grid structure, alignment tools, and ability to maintain consistent styling really helpful for communicating process logic without overwhelming the viewer. It’s great to see others pushing Lucidchart beyond basic diagrams and treating it more like an information design tool.

Would definitely be interested in seeing more examples or learning where others are sharing Lucidchart design inspiration.


Forum|alt.badge.img+1
  • Lucidite
  • January 28, 2026

@Zoe H102 Wow great work! I LOVE branding my designs in Lucid. Visual language is a huge aspect of diagrams that are easily readable & digest-able at first glance. One thing that may be of interest to you if you do not do this already is to have your design scanned for color contrast accessibility - this helps make it readable for more people 😌 Another thing I often do is to use hover text from the conditional formatting panel to make it even more readable for people with color blindness rather than relying just on color coding. 


I really love creating & important custom shapes/icons into my custom shape library and then dragging and dropping the library onto the canvas so I can easily pull out those elements as reusable shapes (also very helpful to do this to make a starting point for other diagram designers in your org that could benefit from using the same color scheme/iconography!) Oh and the Brandfetch integration is also helpful for this to easily pull in branded colors & company logos!!