

Welcome to the new Cloud Accelerator experience!
We're introducing a new experience for the cloud accelerator! We've made some pretty significant changes with our UI in an effort to unify our products and give you the smoothest workflow possible for cloud diagramming.
Starting today, all new documents with cloud data attached will open in Lucidchart by default. Existing documents you've already created will open in the last UI you used by default.
To make sure you have the smoothest transition possible, here's a rundown of where you can find all the Cloud Accelerator features in the Lucidchart interface:
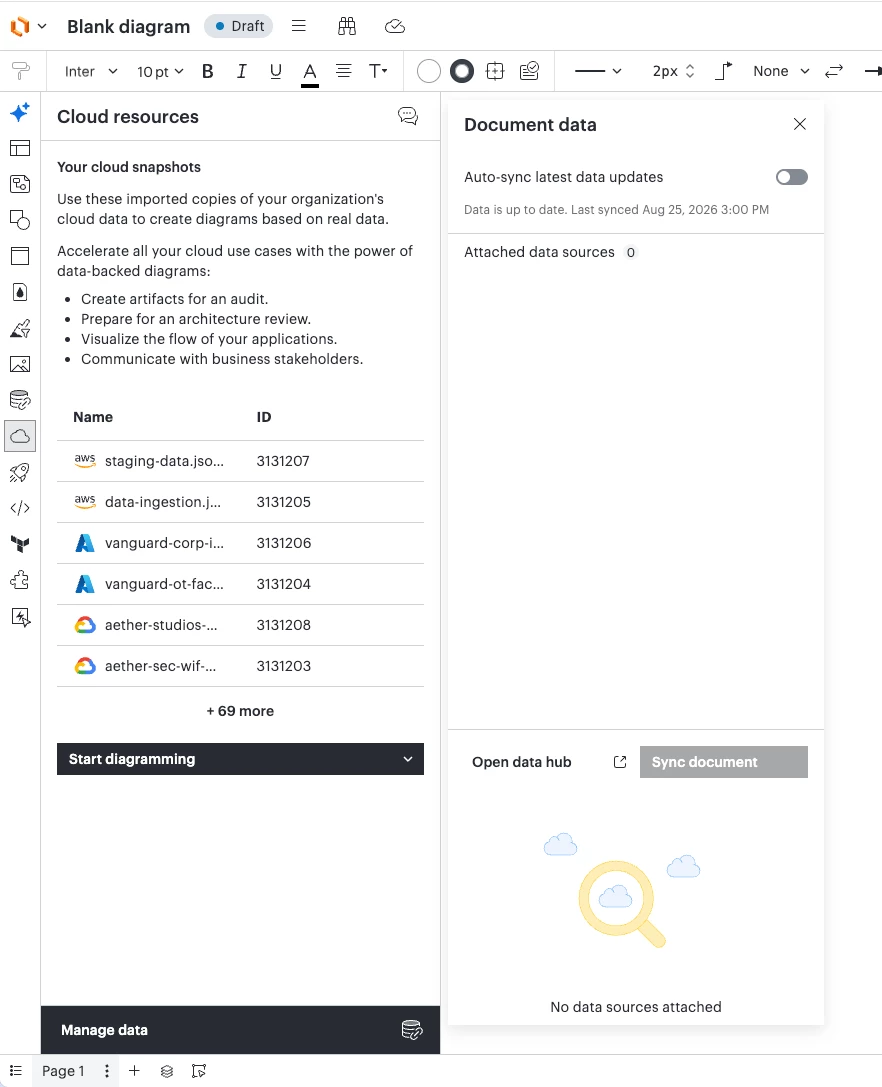
From any Lucidchart document without cloud data attached, open the cloud panel by clicking on the cloud icon in the left side toolbar of your Lucid document. From here you can manage the data connected to your document and access quick start workflows for the Cloud Accelerator. You'll see a short list of suggested cloud datasets you can add to the canvas. You can also click Manage data below to open the data hub. Click here to learn how to import AWS, Azure, or Google Cloud data.
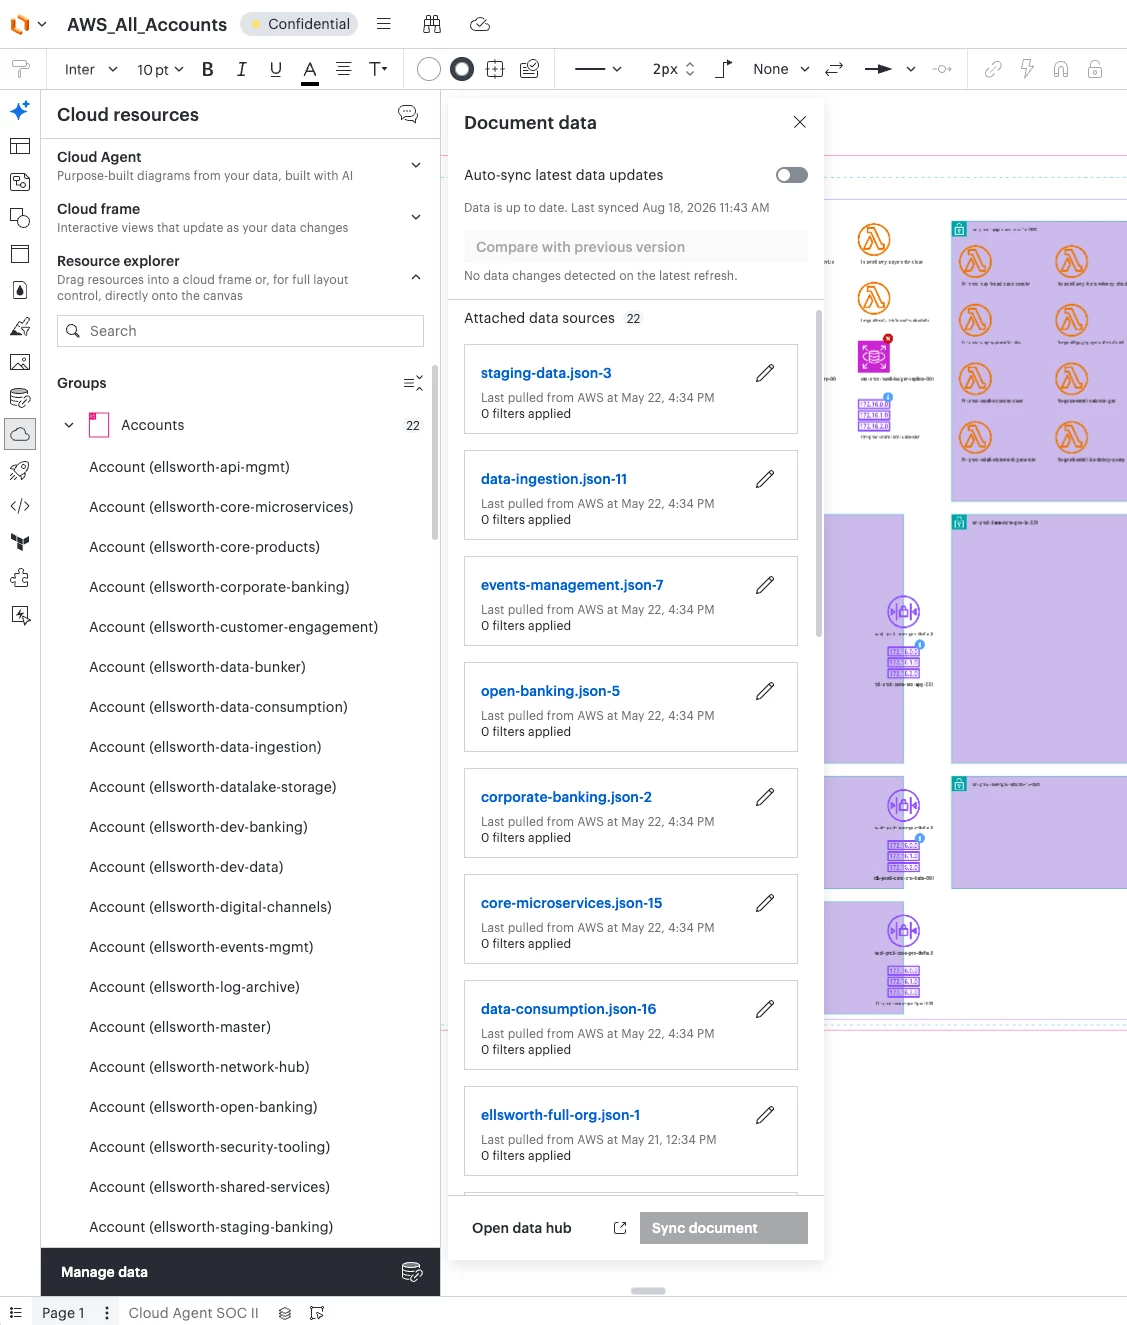
When cloud data has been attached to a document, you'll see the shapes included in your datasets in the resource explorer. If you click Manage data on a document that has data attached already, you can add filters to individual data sets, toggle the auto-sync as well as compare the current data against the previous version. Learn more about version compare here.
You can also create a cloud frame, which allows you to auto-generate diagrams based on the cloud data you've imported. These diagrams follow strict layout rules, allowing you to visually discover and understand your existing infrastructure (more on Cloud frames below!). Finally, in the top right of the Cloud Panel, you can give us feedback (please!) by clicking on the overlapping speech bubbles. We want this UI to be as easy and intuitive as possible for you to use, if you're finding anything difficult, let us know!
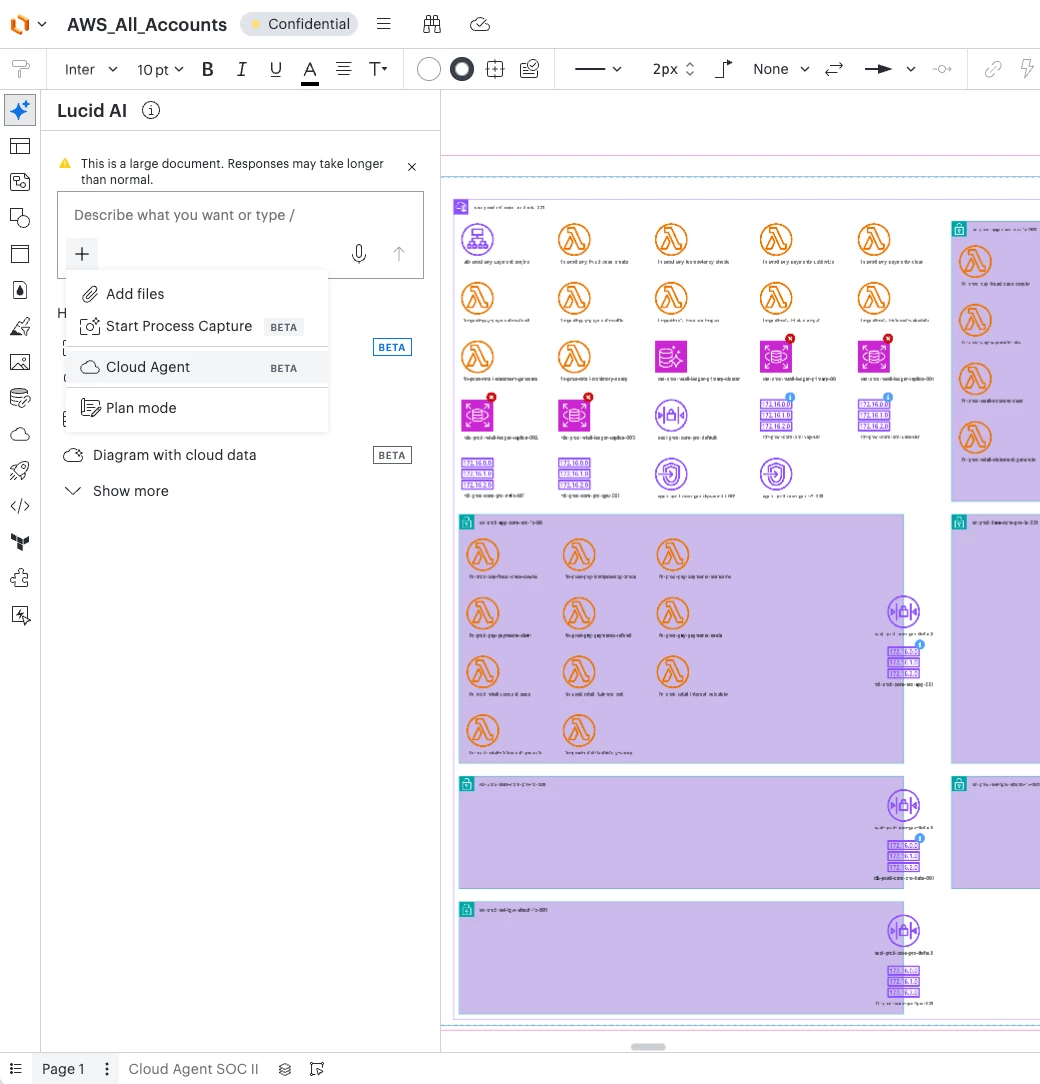
Also in the left toolbar, you can access Lucid AI and the Cloud Agent. Clicking the '+' icon in the chat window in Lucid AI allows you to query the Cloud Agent, which can use your connected data set to generate insights and create diagrams for you. Learn more about the Cloud Agent here.
Note - Cloud Agent is currently in beta and limited to AWS data only
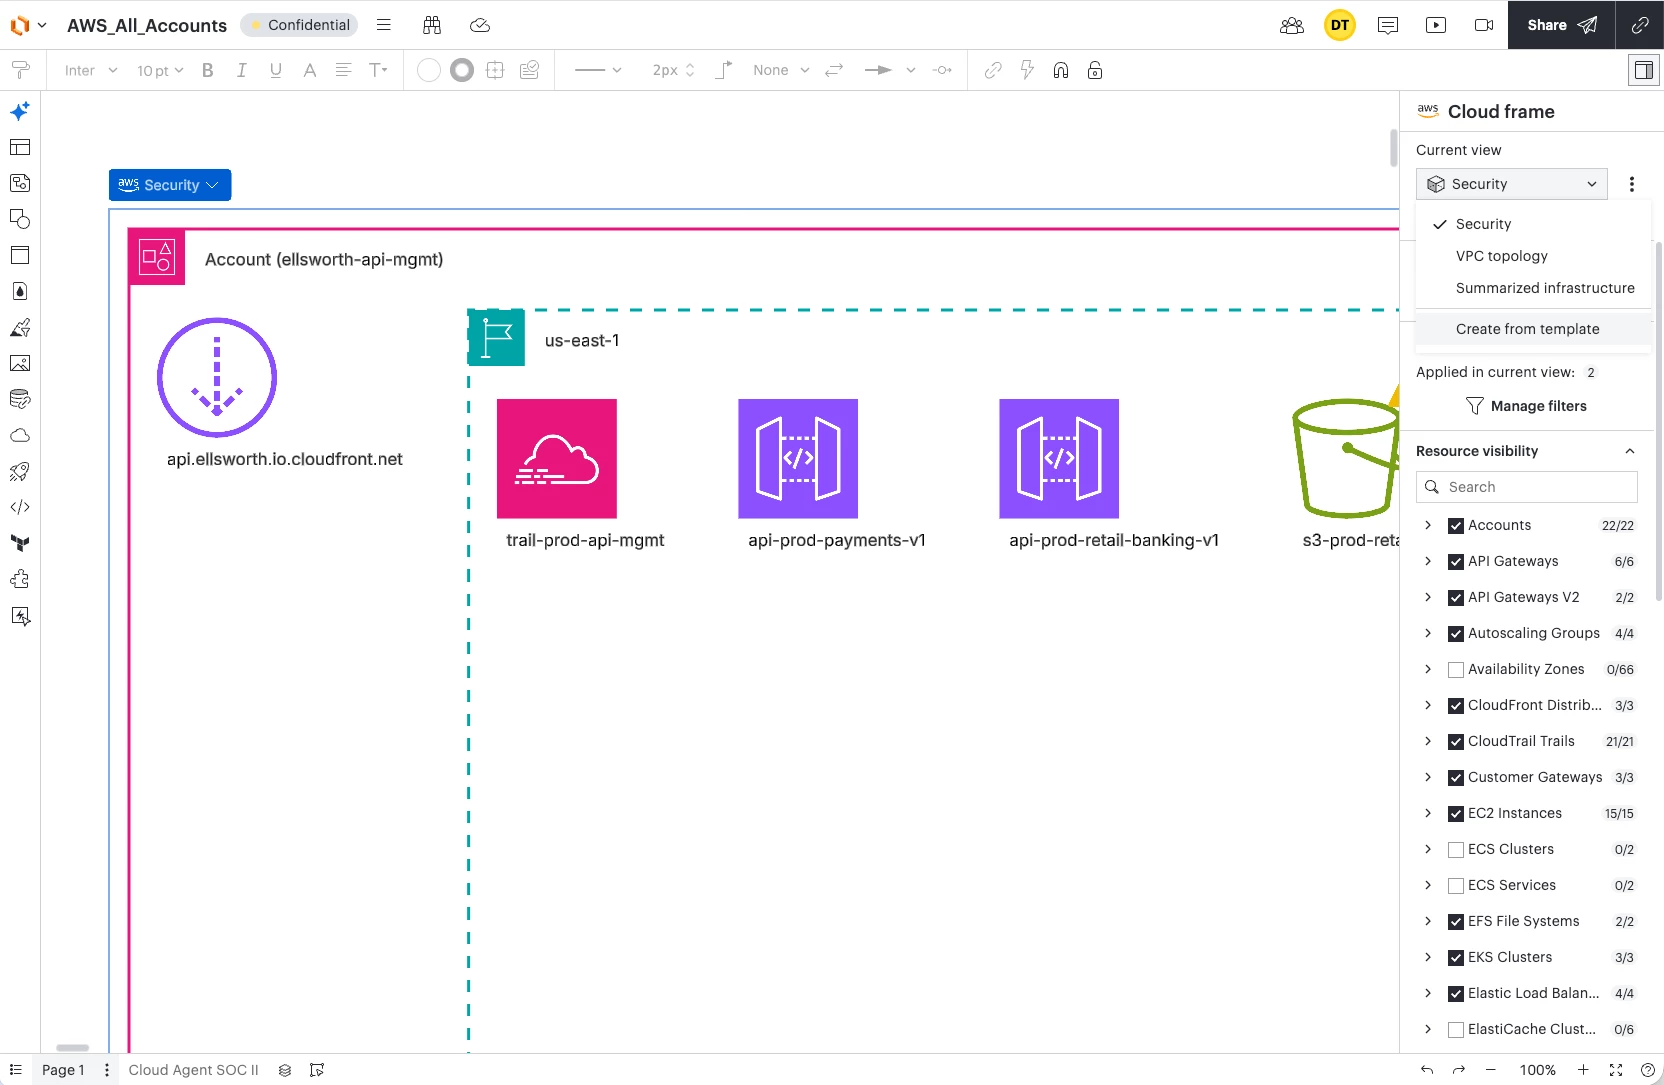
Cloud Frames allow you to auto-diagram the imported data using views which are a collection of layout rules and filters that organize your data on the canvas. Views can be created and selected in the dropdown in the top of the right side data panel. You can choose a view template to startw from or build your own custom view. Read more about cloud frames here
Note - The entire cloud frame must be selected in order to see and select views, filters, conditional formatting, structure controls and more frame level tools. If you've clicked on a specific cloud shape you will only see that shape data in the right panel.
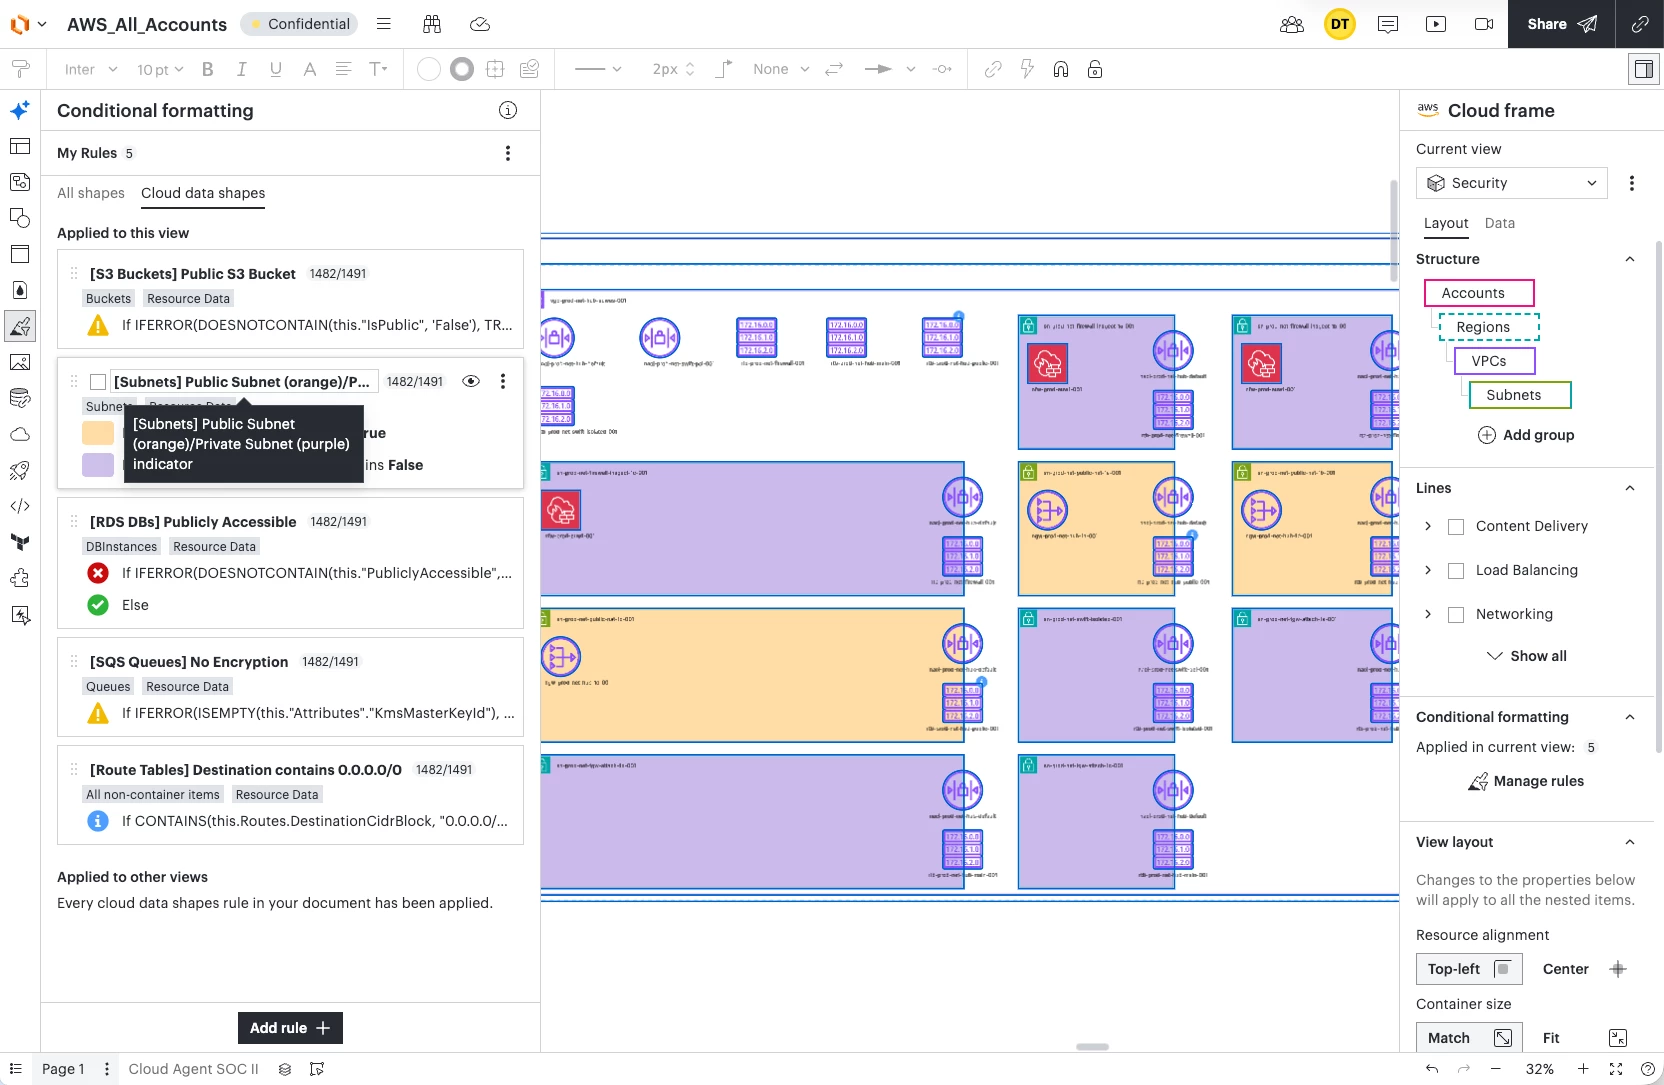
Also in the right side data panel, you can toggle between Layout and Data tabs. The Layout tab allows customization of the view layout including Structure controls, adding and removing Lines, and Conditional Formatting rules.
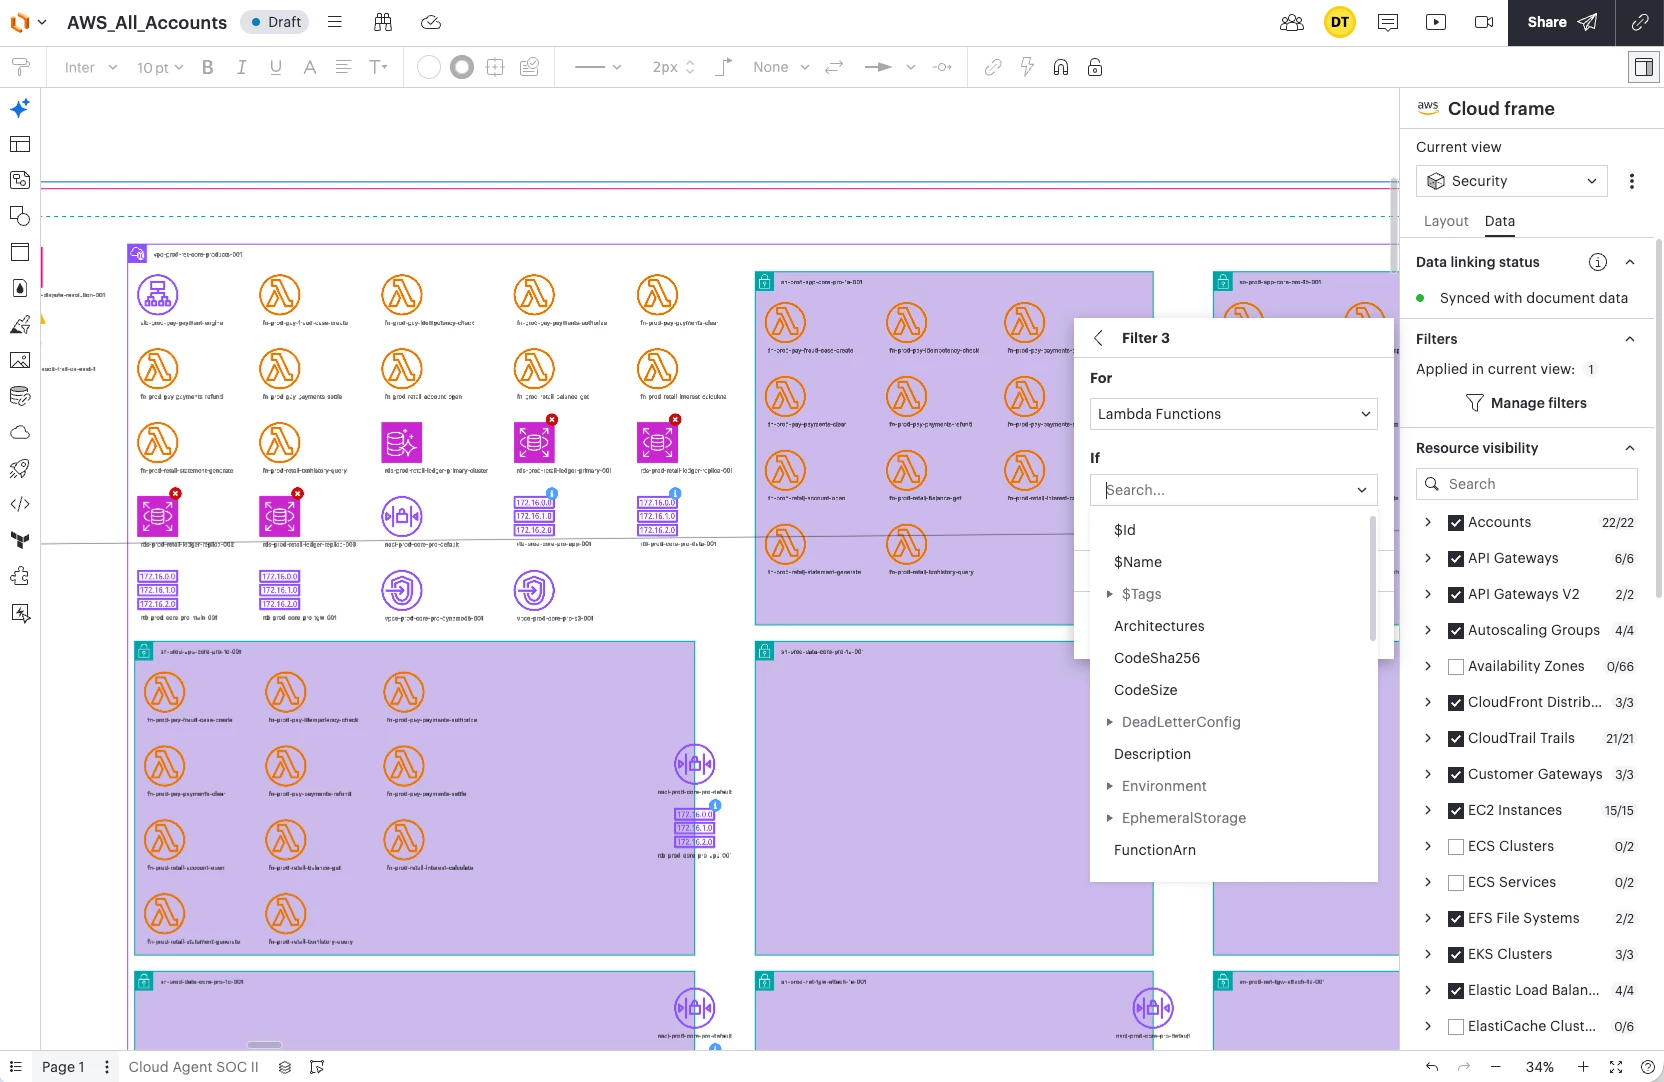
The Data tab allows you to add and manage filters as well as toggle resource visibility and see related resources. Filters leverage your imported data to intelligently remove shapes from the canvas so you can eliminate noise and focus on the specific part of your infrastructure you're interested in.
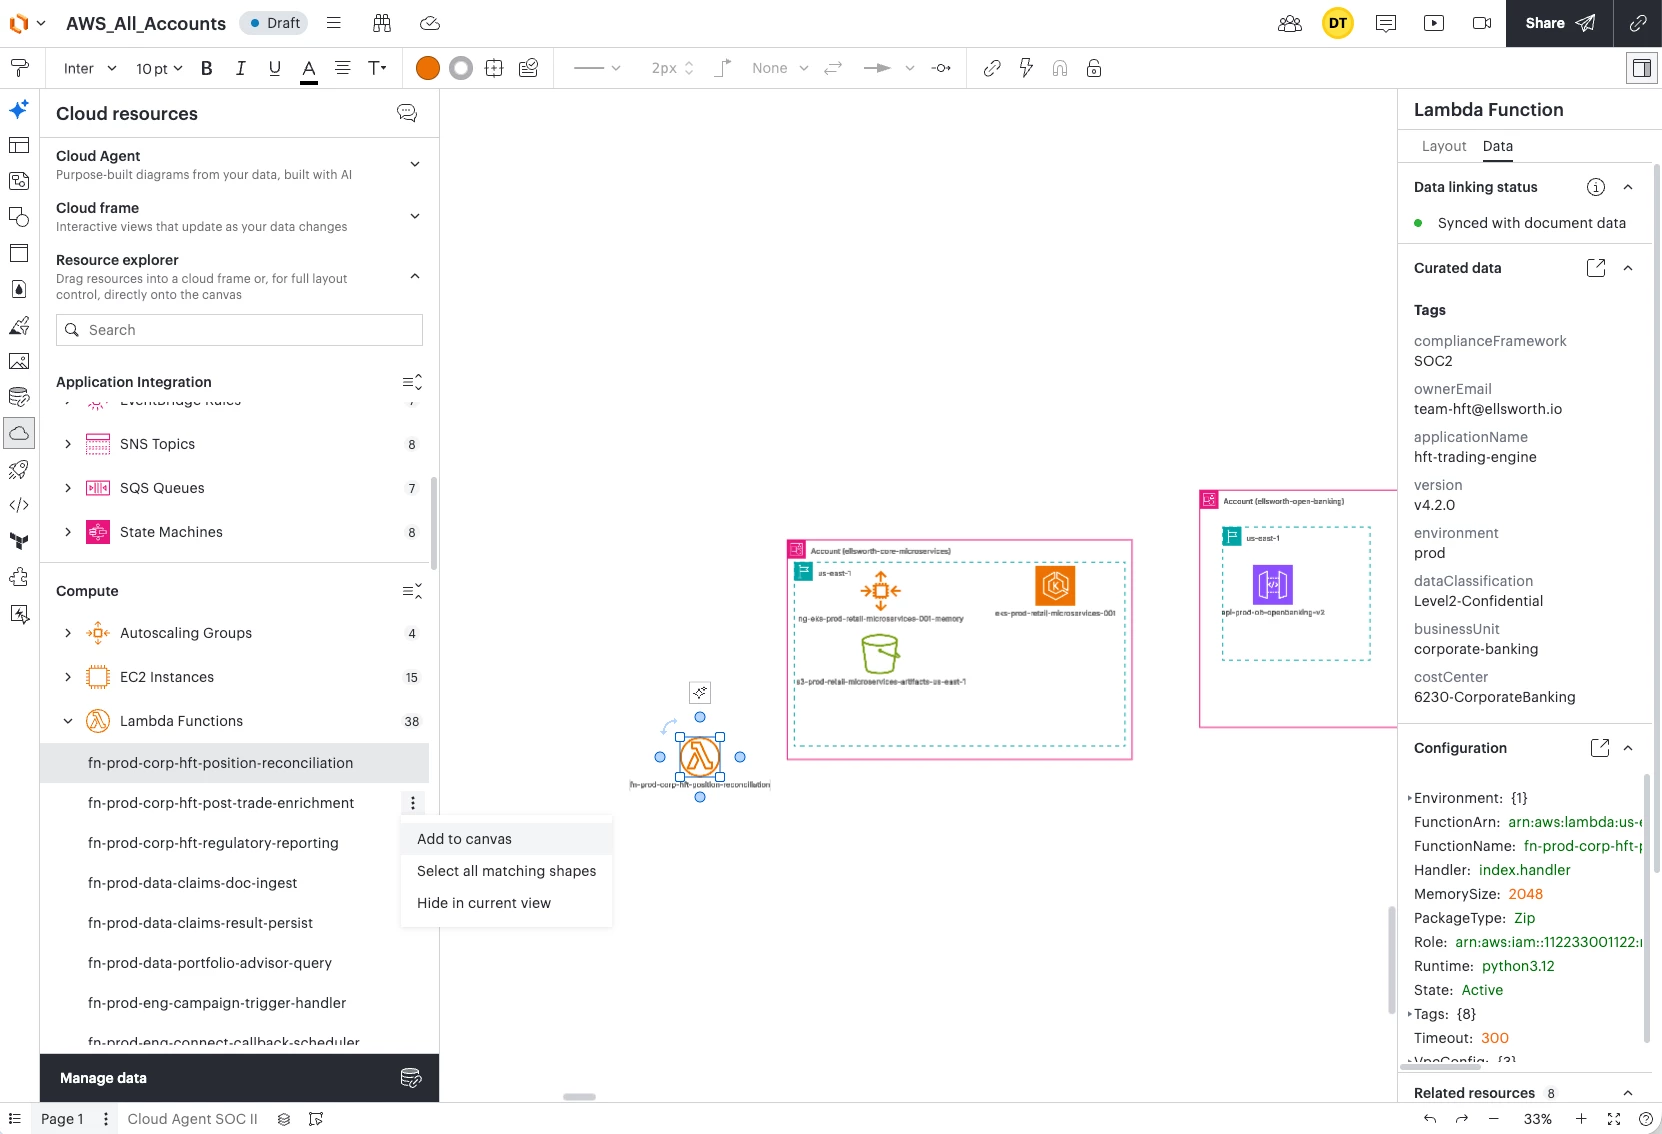
Shapes from your data set can also be dragged onto the canvas without the use of a cloud frame. Simply click and drag the shape from the Resource explorer section of the Cloud panel and drop the resource onto the canvas. These shapes will exist wherever you place them and you have full control over layout. These shapes will exist wherever you place them and you have full control over layout. The right side panel will still show all the configuration data associated with that shape, but you will not be able to apply rules such as conditional formatting, filters, and so on.
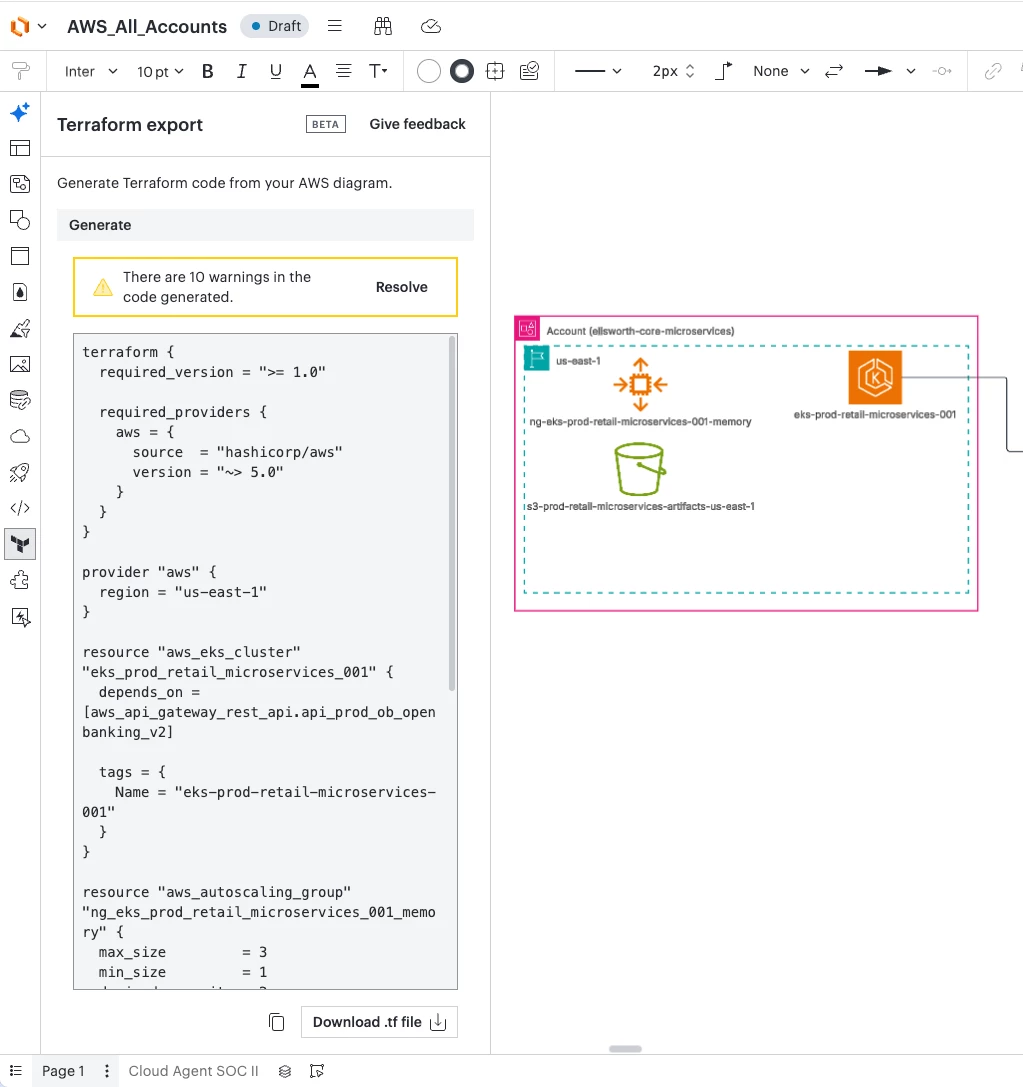
If you want to generate Terraform code from AWS shapes on the canvas, click on the Terraform icon in the left side toolbar. Learn more about generating Terraform code from Lucidchart diagrams here.
Note - Terraform code generation is currently in beta and limited to AWS shapes only
 Your privacy choices


