
Hi everyone! We’ve all been there: You want the automatic, data-driven power of the Cloud Accelerator, but you also need the flexible, freeform canvas of Lucidchart to build out your project proposals and system maps.
Until now, those two worlds lived in separate products. If you wanted that "auto-magic" cloud visualization, you had to jump straight into the accelerator, separating your infrastructure data from the rest of your documentation.
We’re excited to announce cloud frames in Lucidchart. Think of a cloud frame as a "smart container" that brings the automatic visualization power of the Cloud Accelerator directly onto your Lucidchart canvas.
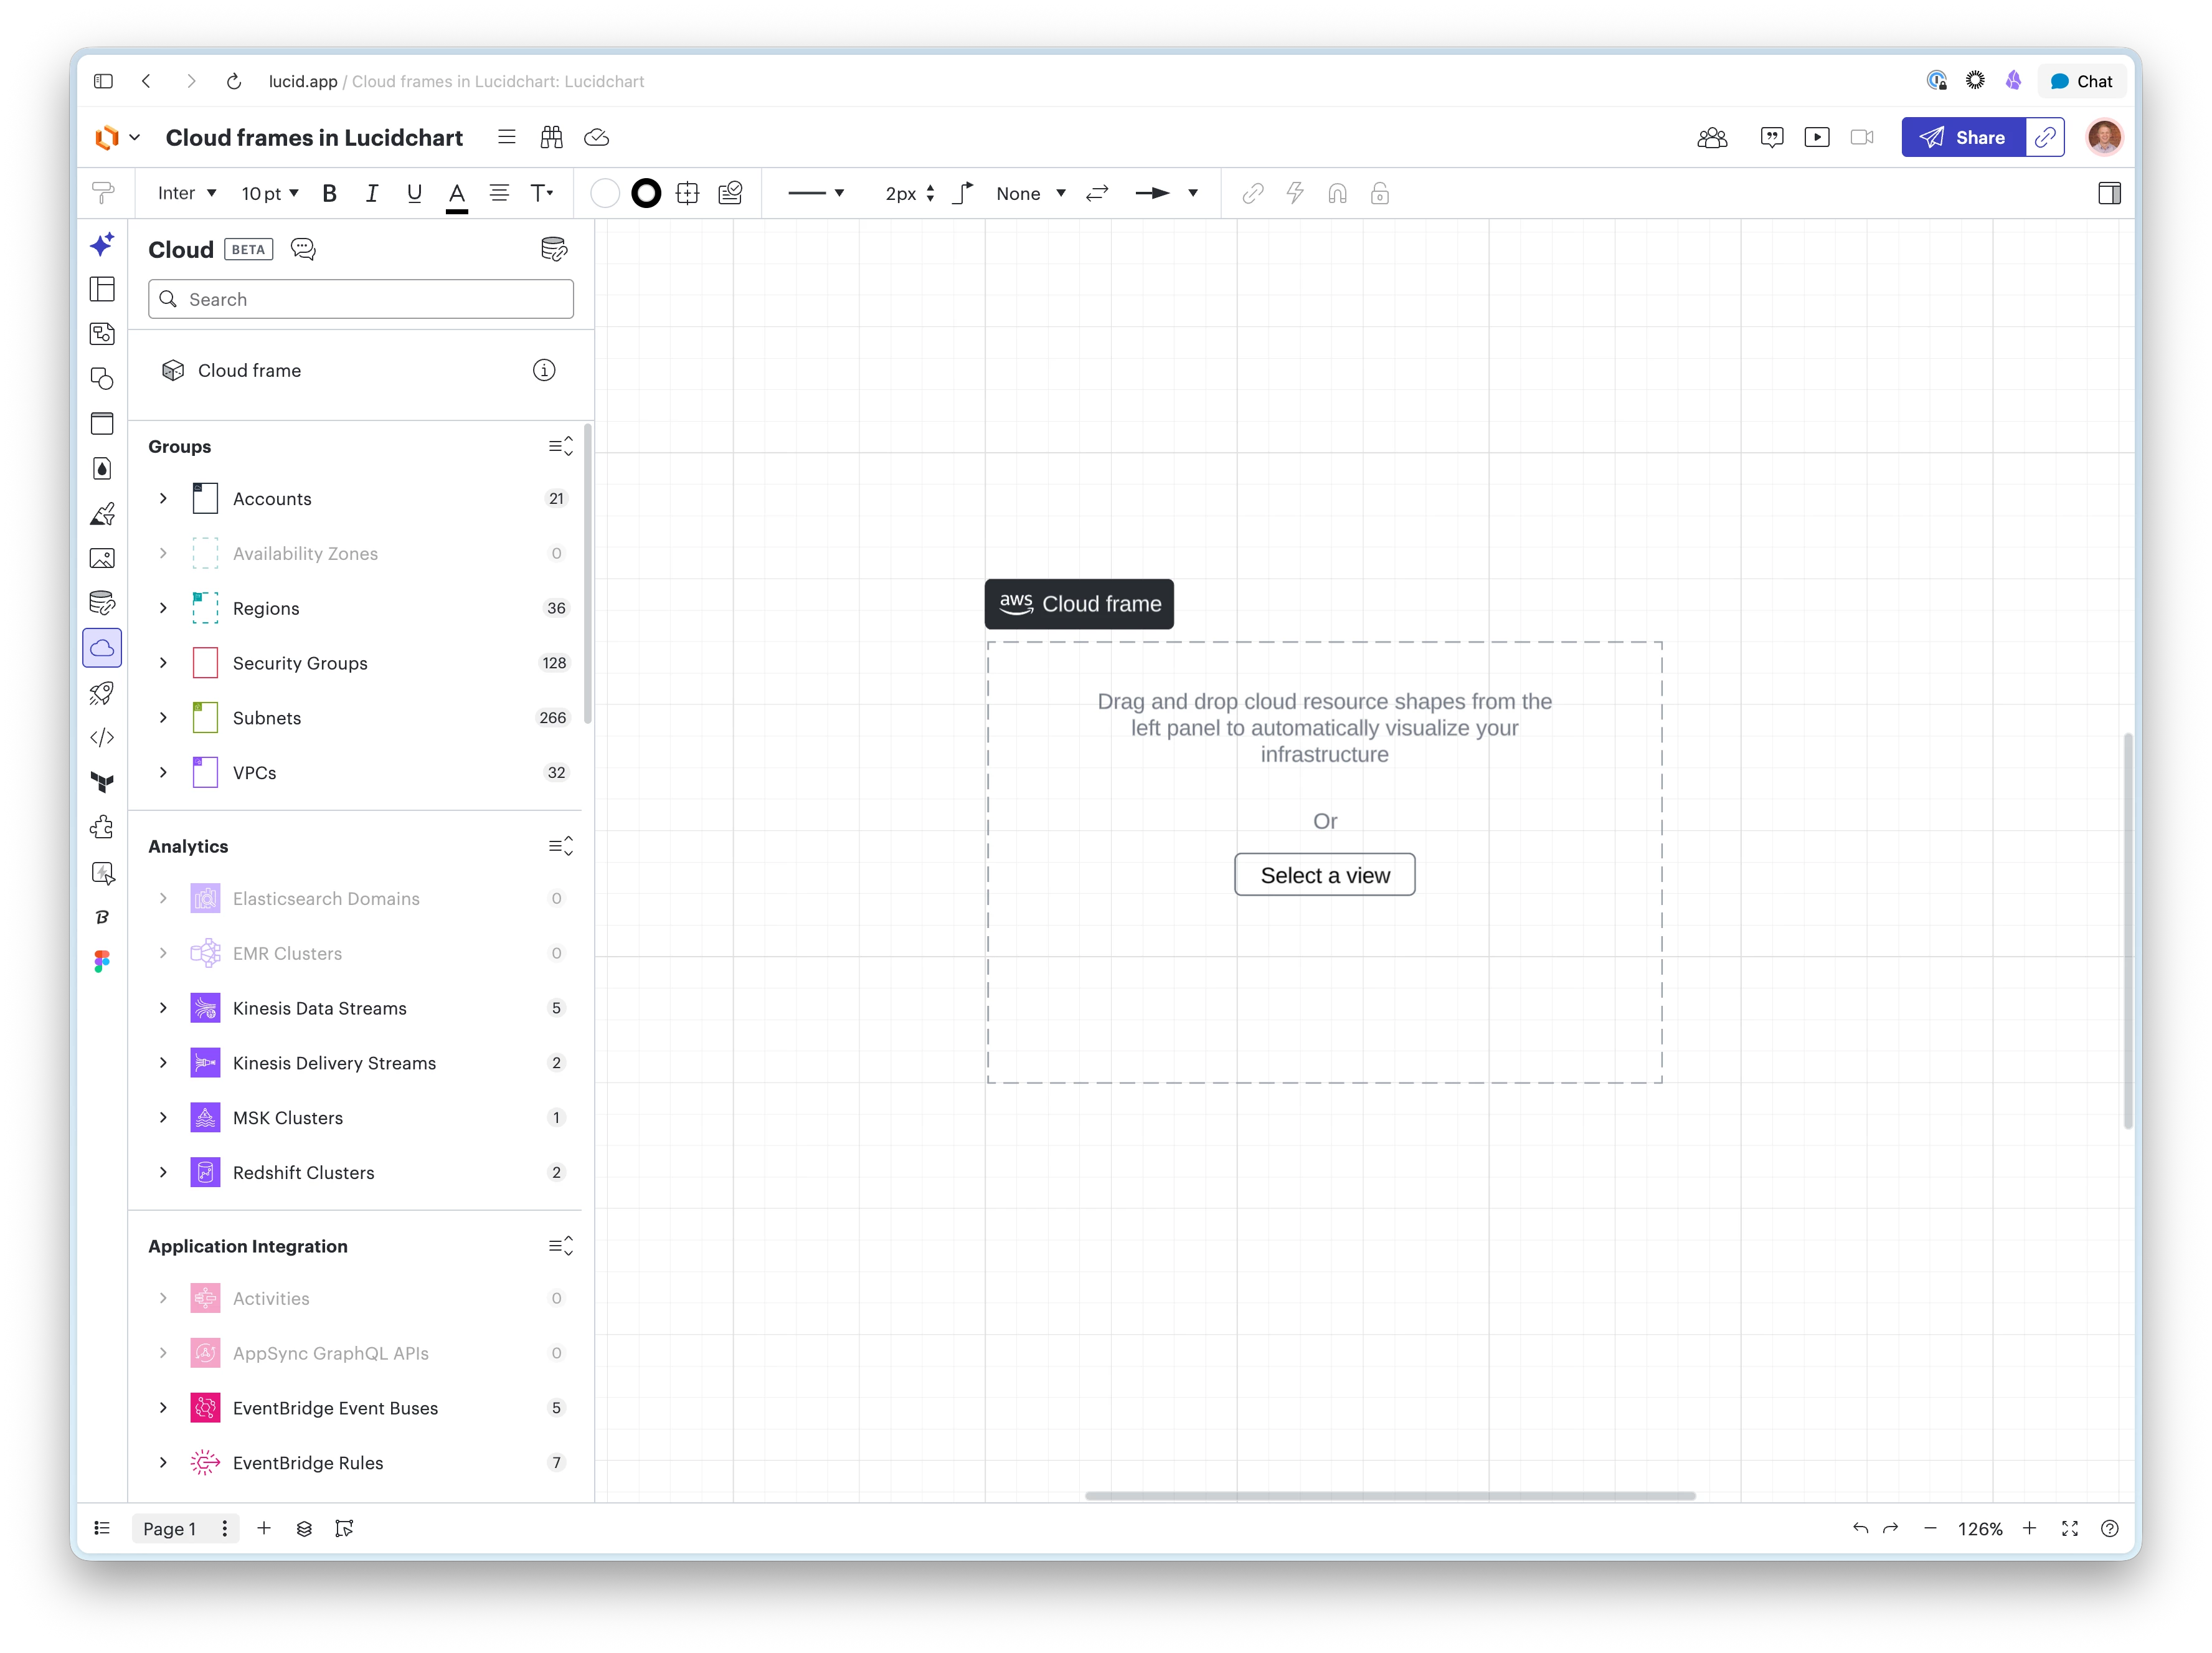
What is a cloud frame?
It’s a foundational tool that takes your imported cloud data and applies the rules you configure—like structure and filters—to automatically generate a diagram. Instead of drawing every icon by hand, you let the data do the heavy lifting.
How it helps your team:
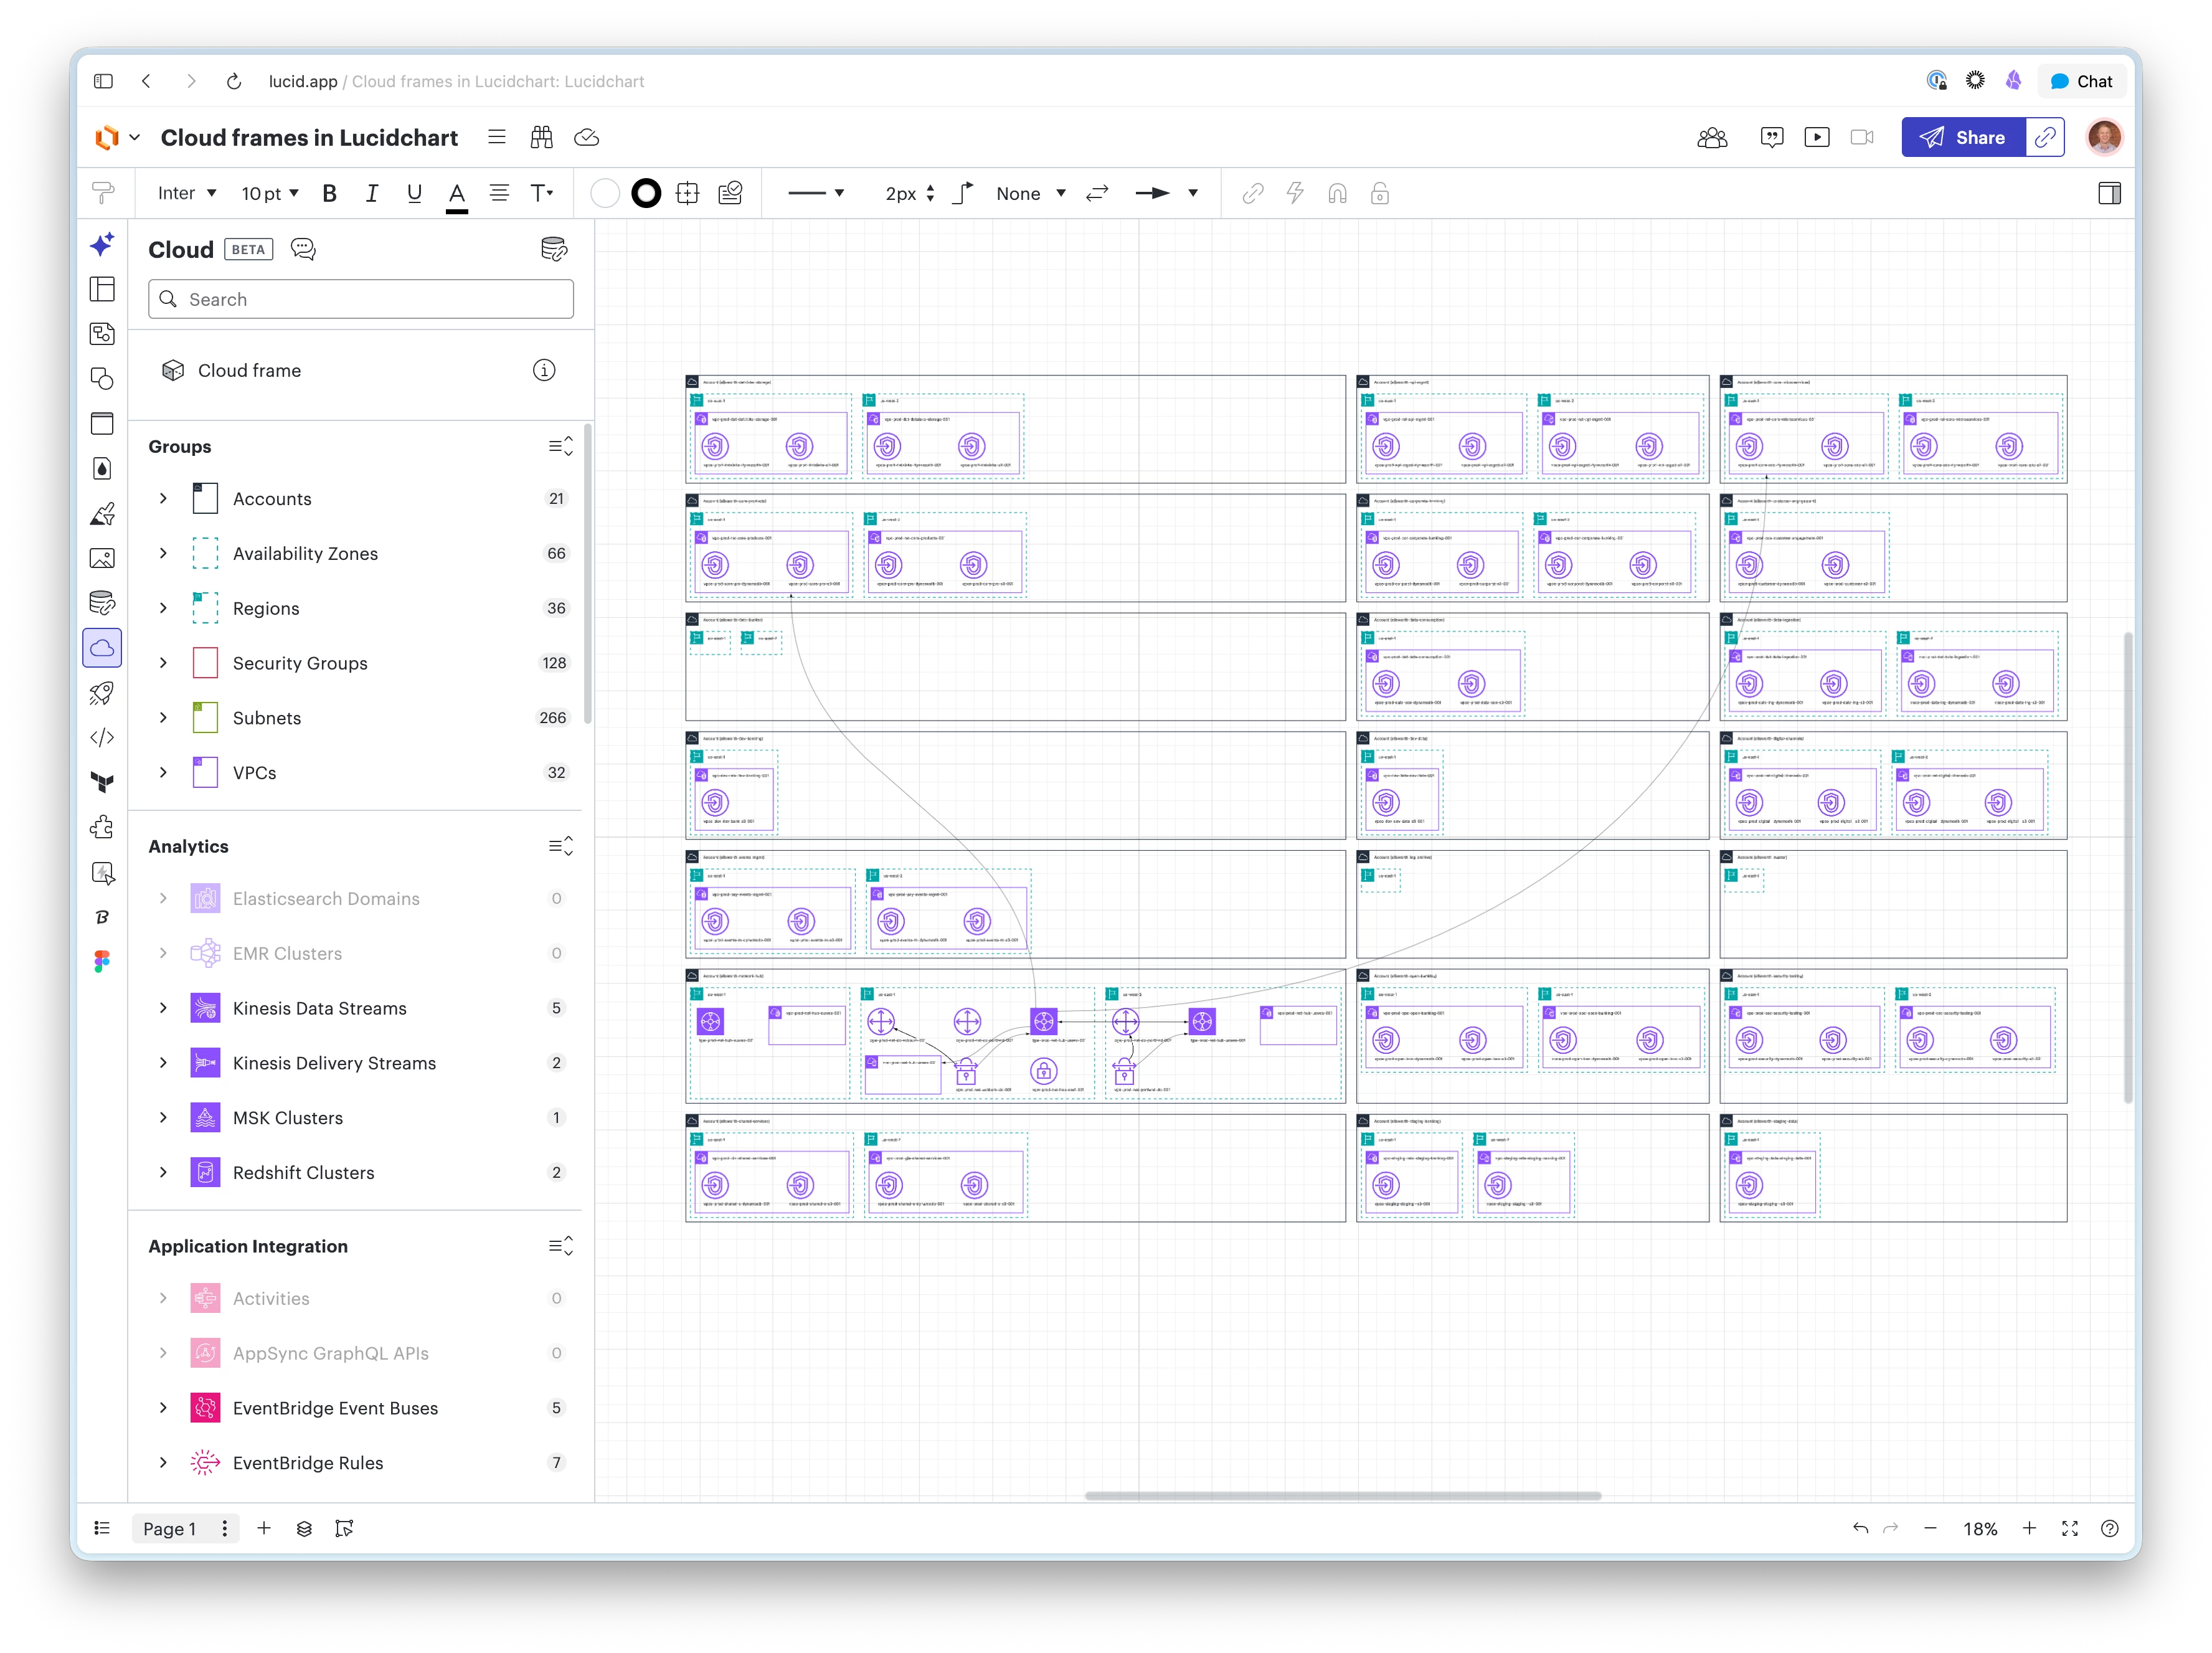
For Cloud Architects & Engineers: Generate live infrastructure and design architectural diagrams in one place. You can now place your manual documentation next to a cloud frame to provide a data-backed "source of truth" without leaving your document.
For Solutions Architects: Speed up your technical reviews. Instead of manually updating shapes as your environment evolves, use a cloud frame to automatically generate a visualization that stays accurate to your cloud configuration.
Example:
Sarah, a Solutions Architect, is drafting a proposal for a client. She needs to show the current state of their VPC alongside her proposed changes. Instead of re-drawing the current infrastructure, she drags a cloud frame onto her Lucidchart canvas, connects her AWS account, and instantly has a live-synced visualization. She spends her time on the strategy, not on placing icons.
Ready to try it? Open a new Lucidchart document and connect your data. Look for the cloud frame icon in your primary toolbar. Simply drag it onto the canvas to get started.
Note: Cloud data can only be added to a new, blank document at this time.
A quick note for our early adopters: This feature is in active development and currently in beta. For now, Lucidchart will house the frames, but to manage complex views or adjust your filters, you'll still switch over to the Cloud Accelerator. Keep in mind that only a single frame may be placed on a canvas. Once you have added resources to a frame or selected a template, it’s there to stay for now (deletion is coming in a future update!).
How do you plan to use cloud frames in your workflow? Are you using them for quick audits, or to add more technical depth to your project docs? Let us know in the comments!
