
When setting up conditional formatting in your Lucidchart document, you have a variety of “If” conditions to choose from, and sometimes it can be difficult to know which to use. This post is going to provide an example of each type of conditional formatting to help you determine which is right for you.
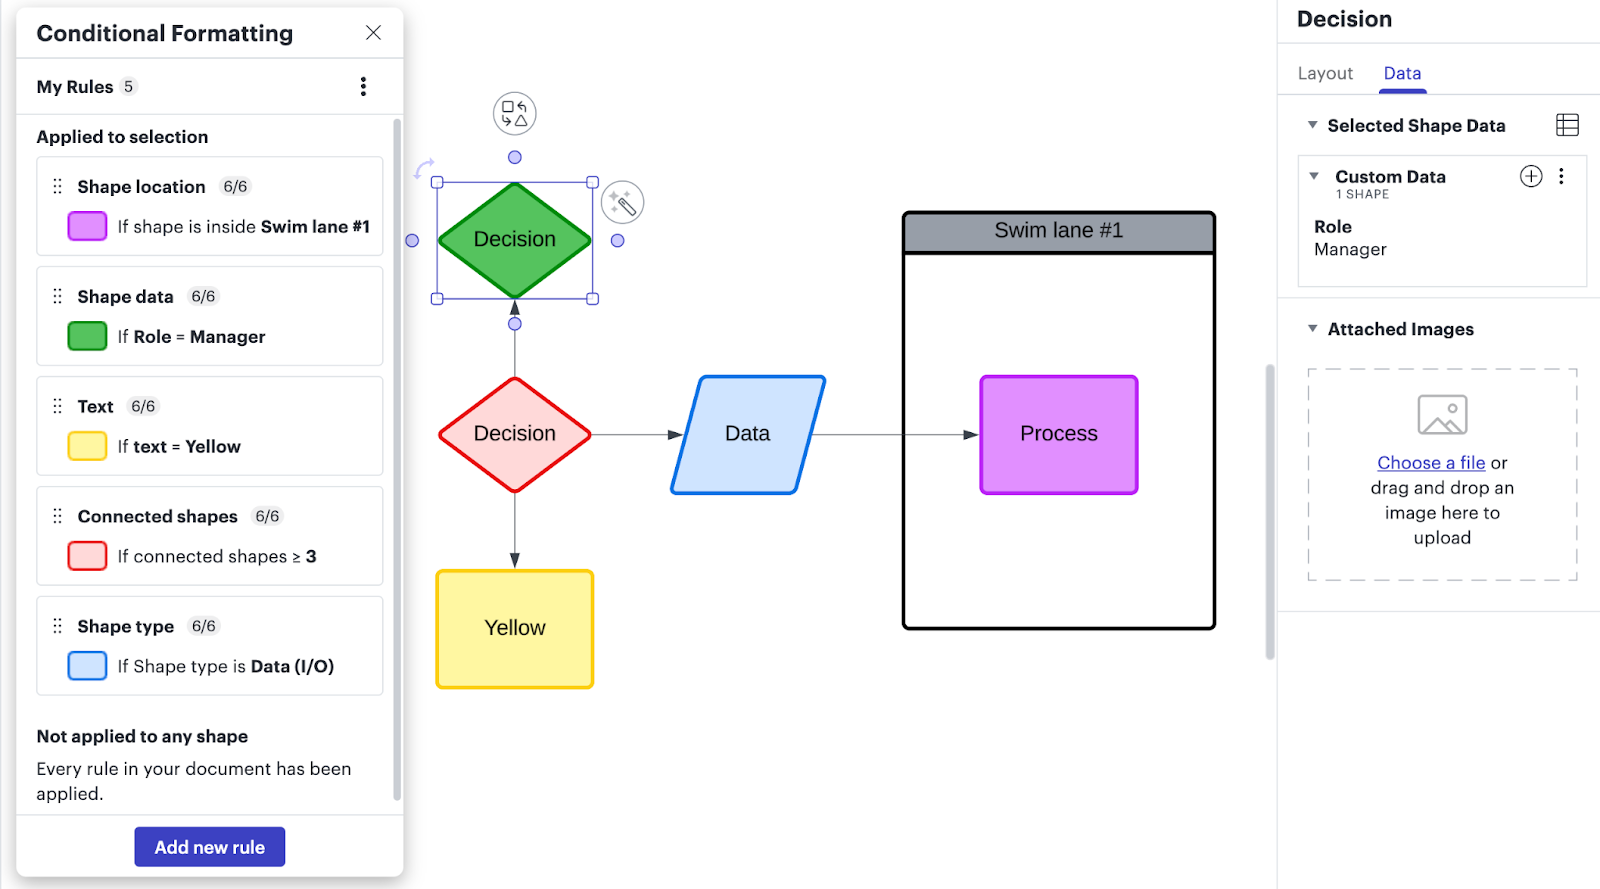
The image above shows an example that uses five of Lucidchart’s six available conditional formatting types. Let’s go through each one!
Shape location
“Shape location” changes the format of an object based on whether it is located inside a particular swim lane or other container shape. In the example below, the rule is set up so that if a shape is inside of “Swim lane #1”, it will turn purple.
Shape data
“Shape data” changes the format of an object based on data that is entered through a shape’s contextual panel on the right-hand side. In the example below, the rule is set up so that if a shape’s data is equal to “Manager” under the “Role” field, it will turn green.
Text
“Text” changes the format of an object based on the text inside the object. In the example below, the rule is set up so that if the text inside of a shape is equal to “Yellow”, it will turn yellow.
Connected shapes
“Connected shapes” changes the format of an object based on the number of other objects connected to it. In the example below, the rule is set up so that if a shape is connected to three or more shapes, it will turn red.

Shape type
“Shape type” changes the format of an object based on what type of shape it is. In the example below, the rule is set up so that if a shape is a “Data I/O” shape from the Flowchart shape library, it will turn blue.

________________________________________________________________________________________________________
The sixth “If” condition option for conditional formatting is using a formula. Check out the example below.
Formula
Formulas can be used in conditional formatting much in the same way as shape data, but allows for more complex and dynamic conditions. For example, you may choose to use a formula when you want to reference multiple pieces of shape data or a dynamic date such as “NOW”.
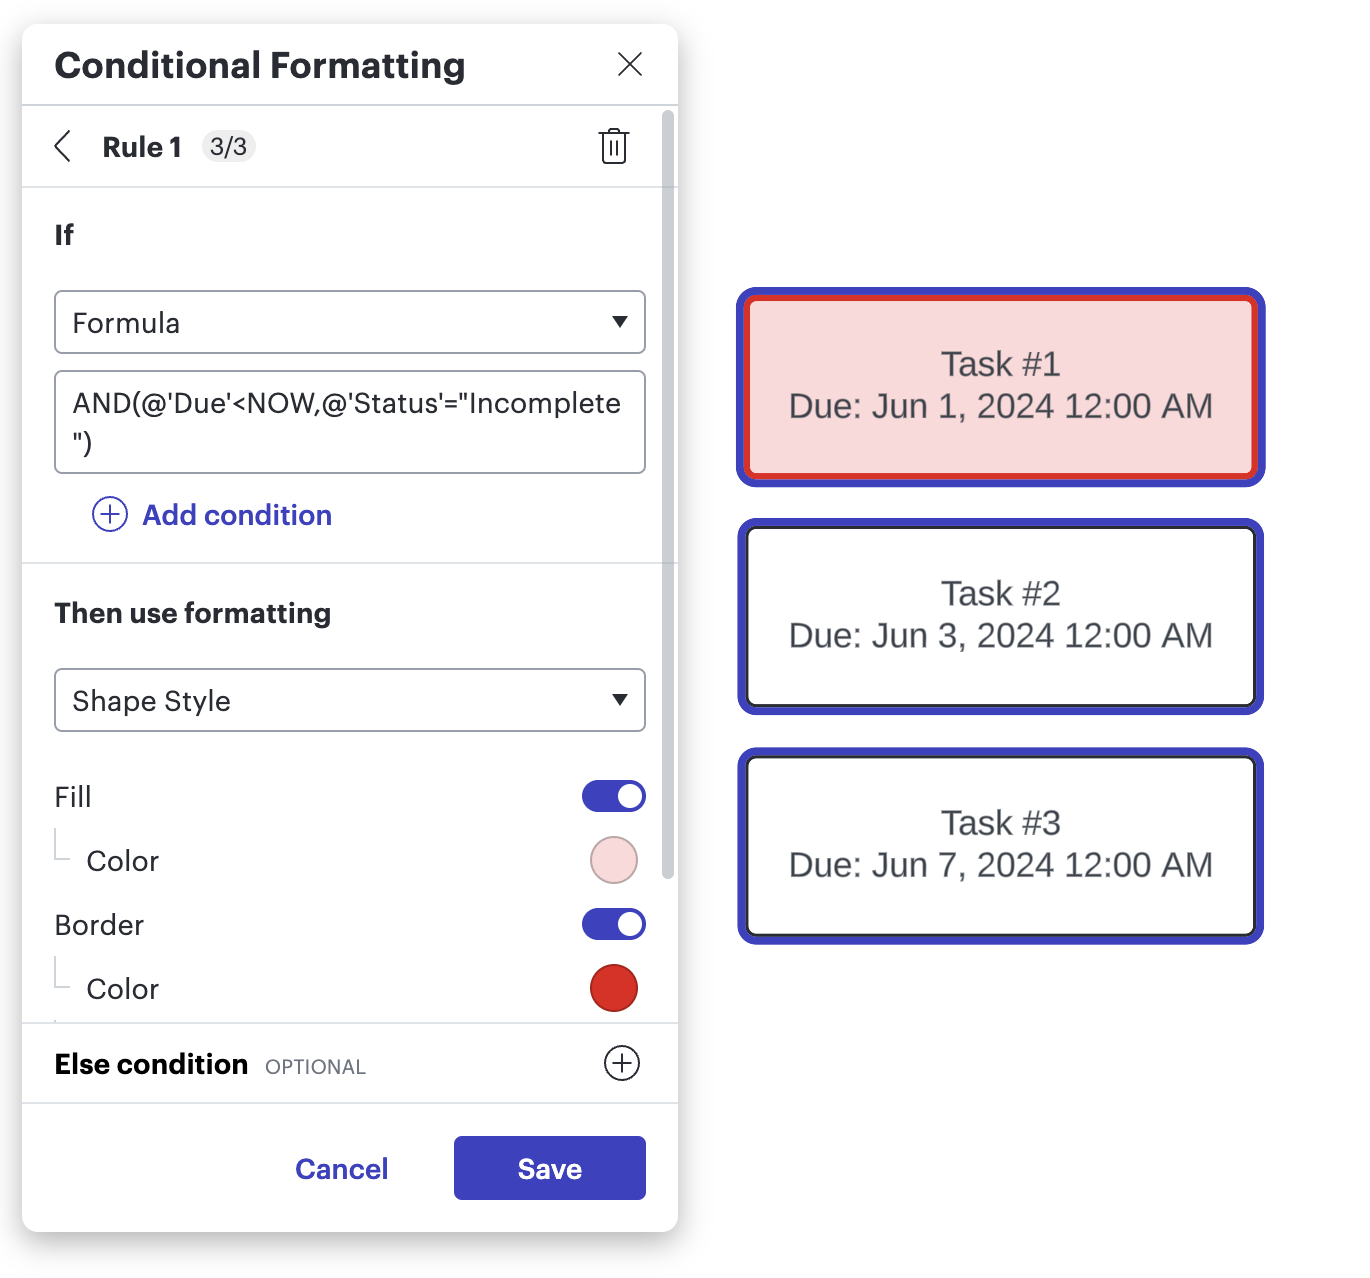
In the example above, the formula is looking at two conditions:
- Whether a task’s due date is less than (or before) NOW (today)
- Whether a task’s status is “Incomplete”
If a task’s due date is before today AND the task’s status is “Incomplete”, the format of the shape is changed to be filled in red, indicating that an incomplete task is past due.
________________________________________________________________________________________________________
We’d love to see your conditional formatting examples - if you have a cool one, drop it in the comments!
