Hello we are a construction company with multiple job sites operating daily.  Ever since going remote this year my company has yet to find an online solution to show us a visual snapshot of who is where.  I was told about your product and want to know if you have what we need.  Here is what we need specifically:


1. A mind map format that will have multiple parent tags/nodes that show each job site name and address.


2. A child node to each parent that shows the trades (carpenters laborers apprentices in this case).


3. A child node under each trade that shows each employee's name and employee number.


4. A way to count how many carpenters are at each job site laborers etc and include a count of the total employees at each job site.


5. A way to export the data to a csv/excel file that show at minimum a) job site name b) how many people are at that job site.


6. Bonus feature: history of which employee moved to and from which job site daily.


Can Lucid do this?  Thanks!


Hi Eva


Thanks for posting on the community! There are a couple of ways you can create your diagram and fulfill most of your specifications.


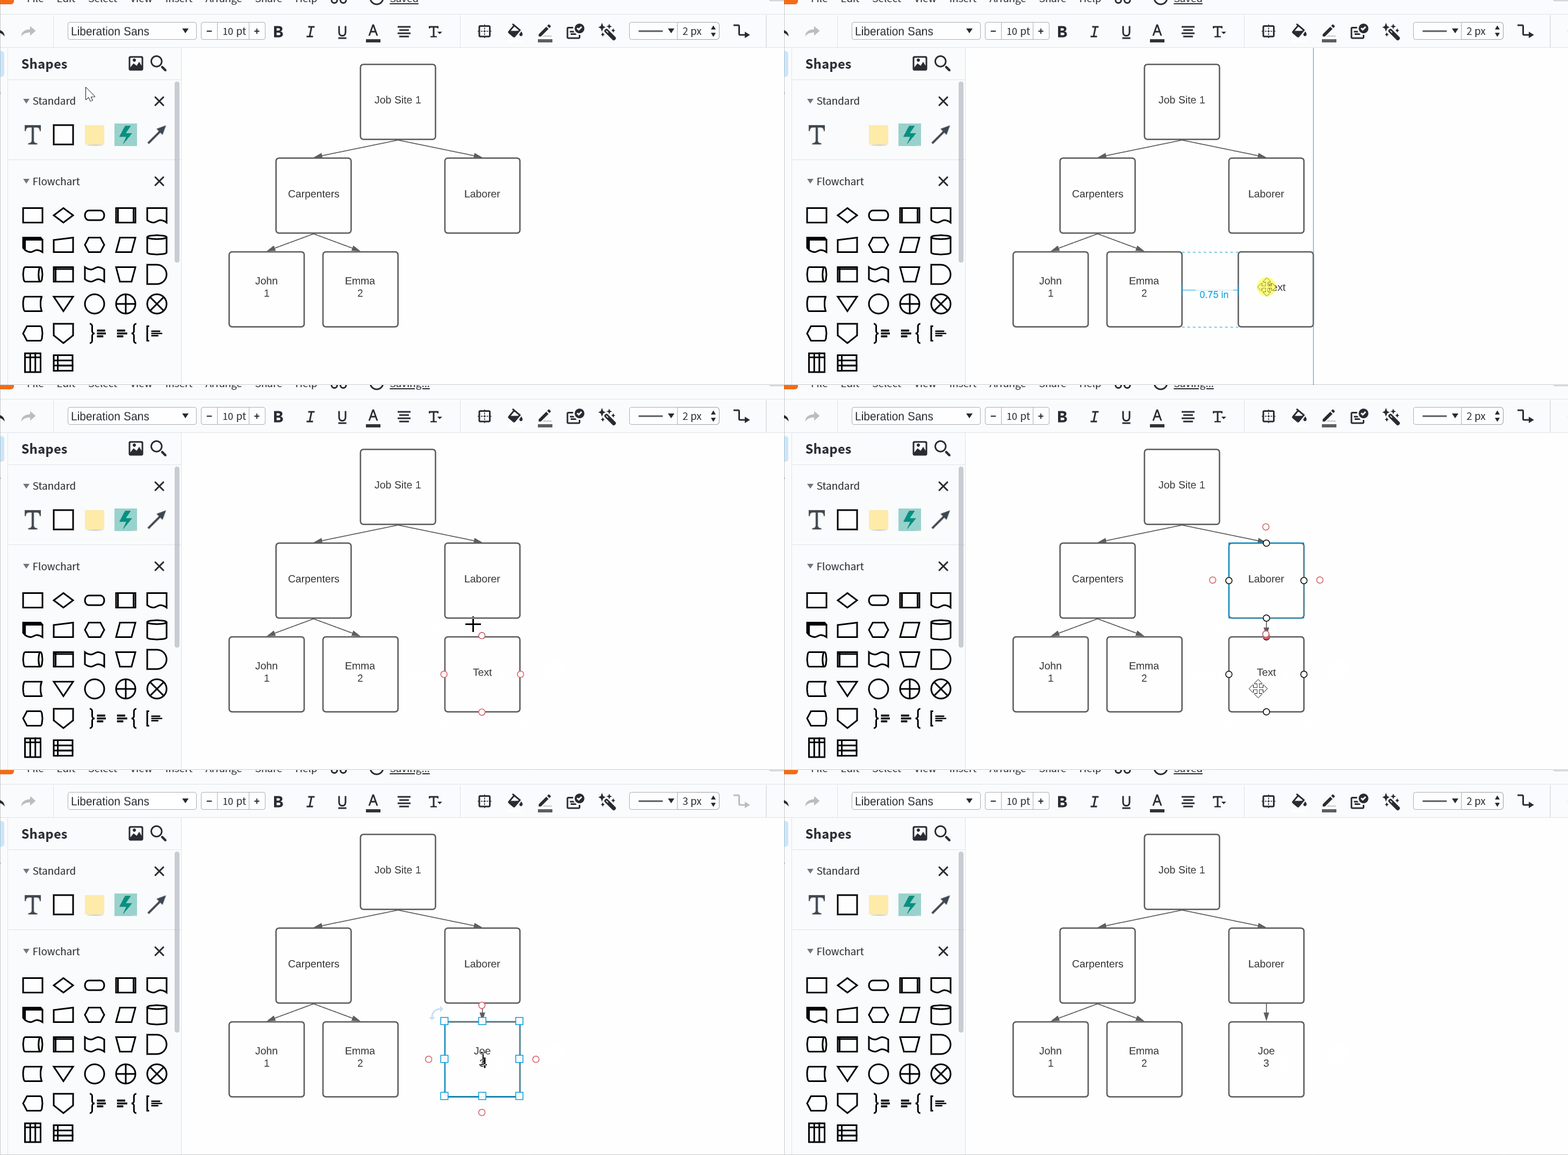
First you could create your diagram using our basic shape library. To learn how to get started look at our Get Started With Lucidchart section. You can pull out shapes add the data of job site trades and employee information and connect them using lines (see gif below).


Unfortunately this method does not have the ability to count how many people are in each trade.


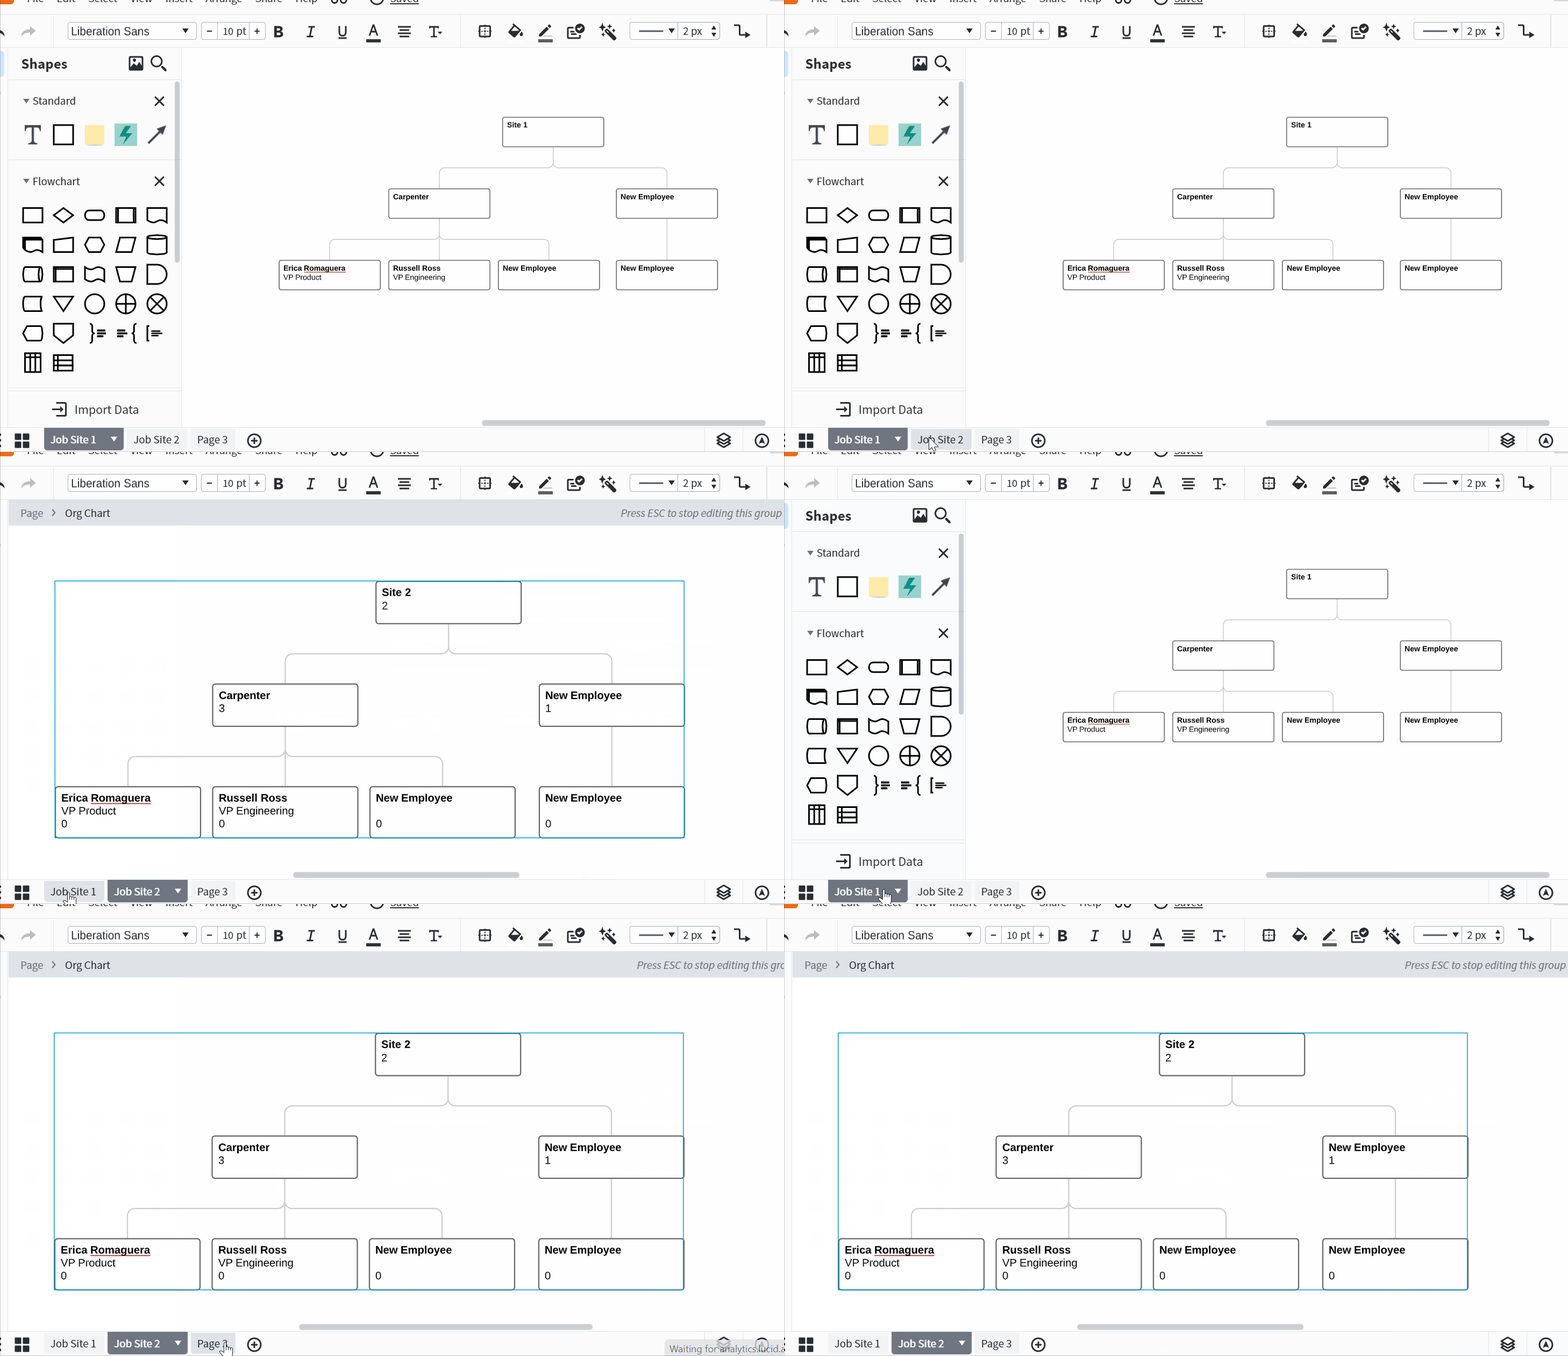
The second method you could use is through org charts. First to learn more about org charts take a look at the Org Chart article in out Help Center. You can pull out an Org Chart shape from our Shapes library to get started. 


  1. For your first need you can do this in a few different ways. First you could create a different Org chart for each location and address.

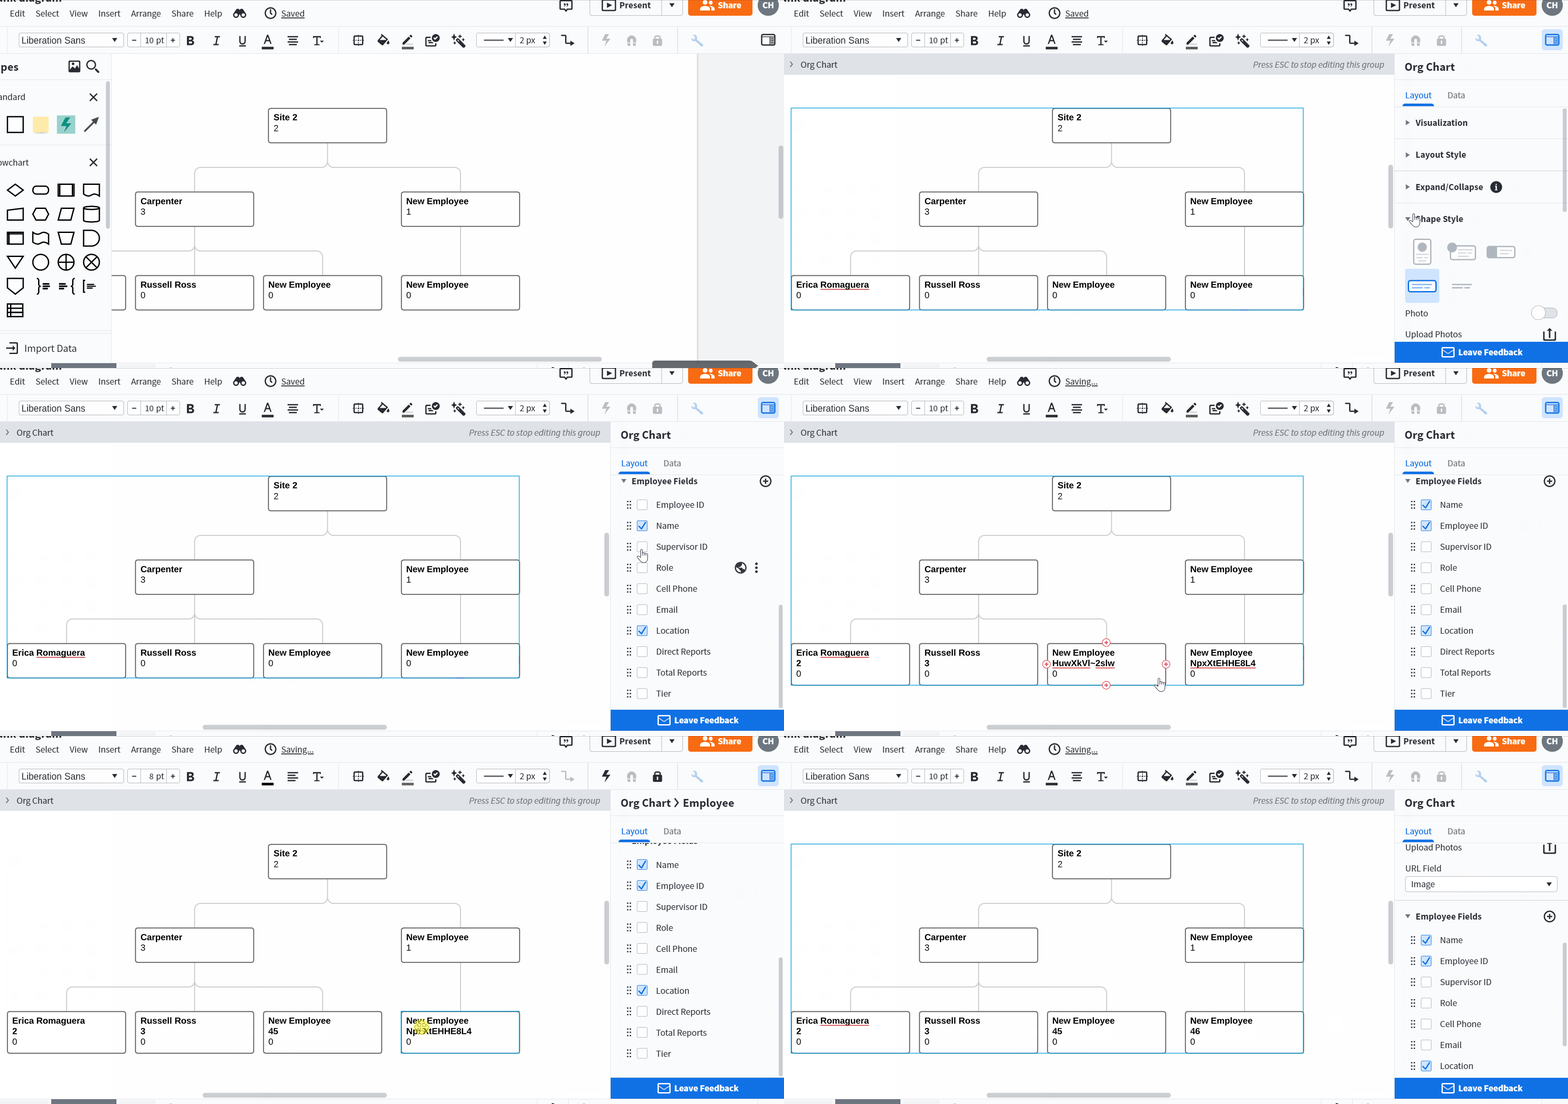
  2. Next you can create and show your own employee fields to format the trades names and ID numbers of each work site.

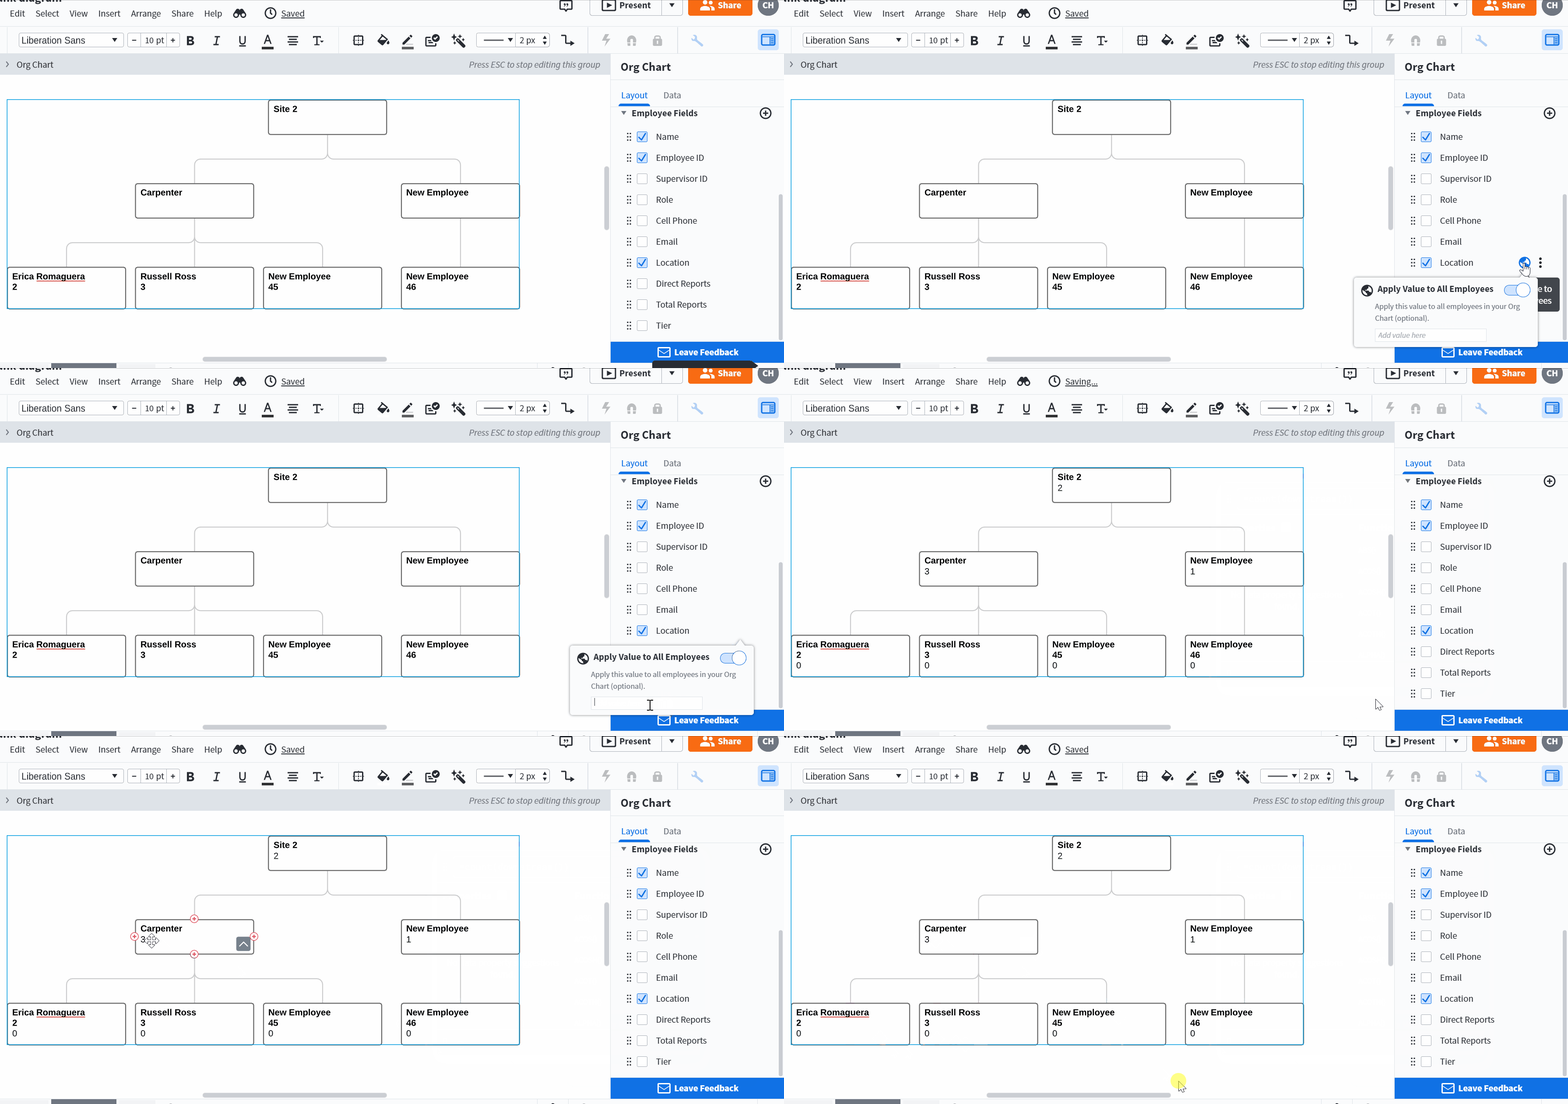
  3. You can use formula's to count how many people of each trade are at a job site. In particular you are looking to count all of the child node that are downstream from each trade. To do this use "=count(downstream())". Take a look at this Community Post and our Formulas Article to learn more about how to use formulas.


Whether you create your diagram the first or second way you can export the diagram as a CSV file. To do this select File > Export > CSV of Shape Data. If you want to learn more about exporting your document read through our Export Your Document article.


For your bonus feature and any other feature we don't support fill out our feature request form. Ideas submitted to this form are passed on to the product development team for their consideration so users may be able to use them in the future.


Hope this helps! If you have any other questions please reach out!


Reply