
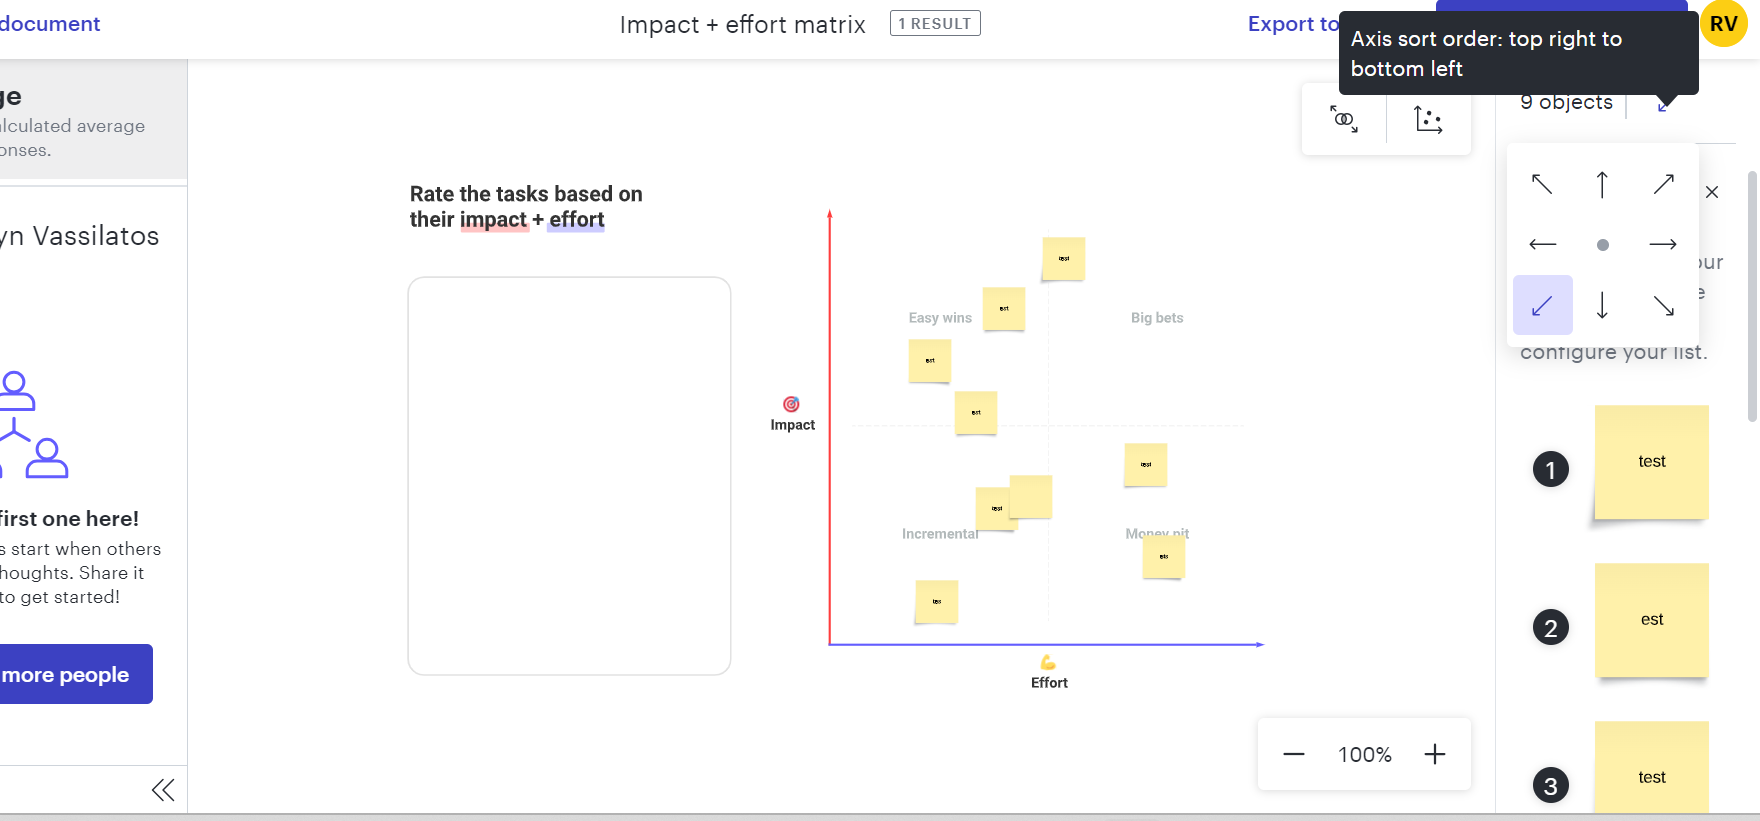
I created a visual activity with results, I attempted to export the results and the export did not show the post it in the order based on the results. Is there a work around to this? 

Can you share an image of what you are seeing and describe what you expect to happen instead?

The only thing I can think of without seeing more is that you may need to define the order you expect results to show in, as shown in this gif.


Hi, thanks for answering I had to create a ‘test’ one to show see below of the results and then the excel of the results. As you can see it doesn’t follow the order. I also noticed, in the original that I’m unable to show, it didn’t give the option ‘export to csv’ on the activity. I had to add results to board and export that way.


I tried exporting directly from the activity and from the results added to the board, and it looks like adding the results to the board and exporting those actually gives more information, including “rank: x” and “rank: y”. The only workaround I see is to export from the results, delete the rows you don’t want, and sort by rank or score. Unfortunately, there is no combined rank using x and y.


If you would like to request changes by the product team, you can follow these instructions to leave feedback that will get in front of our product managers for prioritization.


Adding the results to the board then exporting that section still doesn’t rank the results as they should be, which makes it difficult to use these results without manual effort outside of Lucid. Definitely a product request 


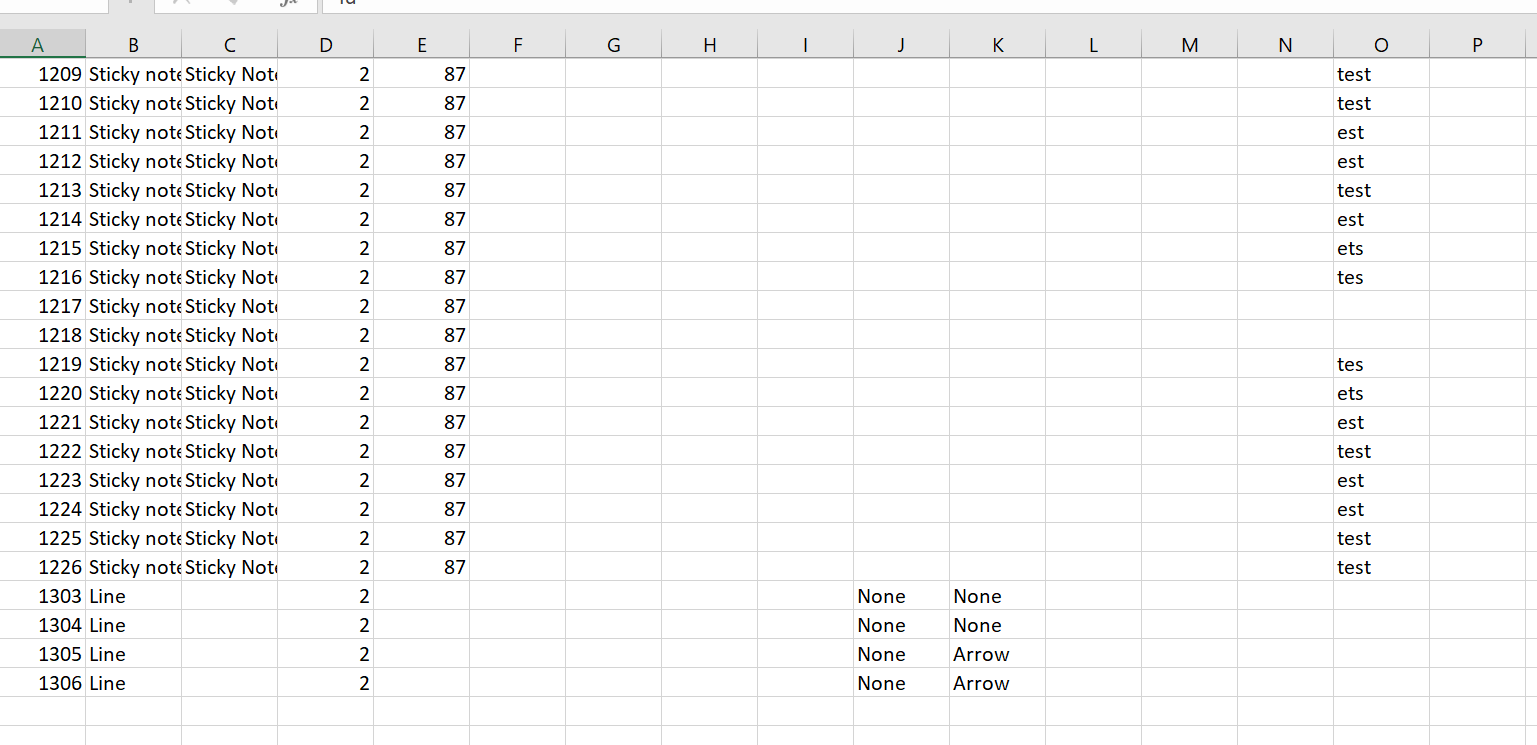
Interesting. I’m getting a lot more data with my export unless yours is beyond the edge of the screen. Here’s the data I see (after deleting rows I don’t care about and columns that were empty).

And here is how I exported it so you can see if we are doing it the same way.


Yes! you were right, it was way off to the right. It ranks it based on the axis i see so it would be up to the user to figure out an average rank, am I getting that right? I see the median scores, but is there something to show how to comprehend the data since it won’t export in the rank you choose?


Yep, that’s right. Since we only have ranks by axis, it would be up to the user to figure out the average rank. I still think this would be a great product request.


No, I don’t see anything that shows how to comprehend the data. The scores appear to be percentages for distance along the axis.


Thank you @rvassilatos for sharing your feedback! For anyone else interested in this feature request, please upvote it here: 


Reply