
Hello I have a chart that has linked data. I want to add a unique shape that includes a simple COUNTIF formula that will just return a title and the count amount using a formula. 


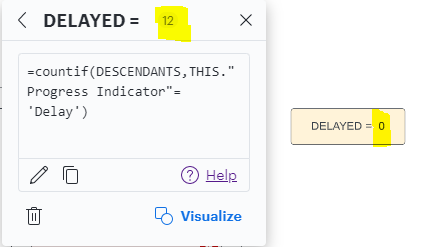
E.G. I have a column in my linked Excel sheet for Progress Indicator. I have a total of 98 shapes linked to the data and there are 12 of the 98 SHAPES has the Progress Indicator showing as 'Delay'. So I just want a line in my unique shape as Delay = 12. 


I have looked at all the related community post responses and tried them all. I still get '0' despite 


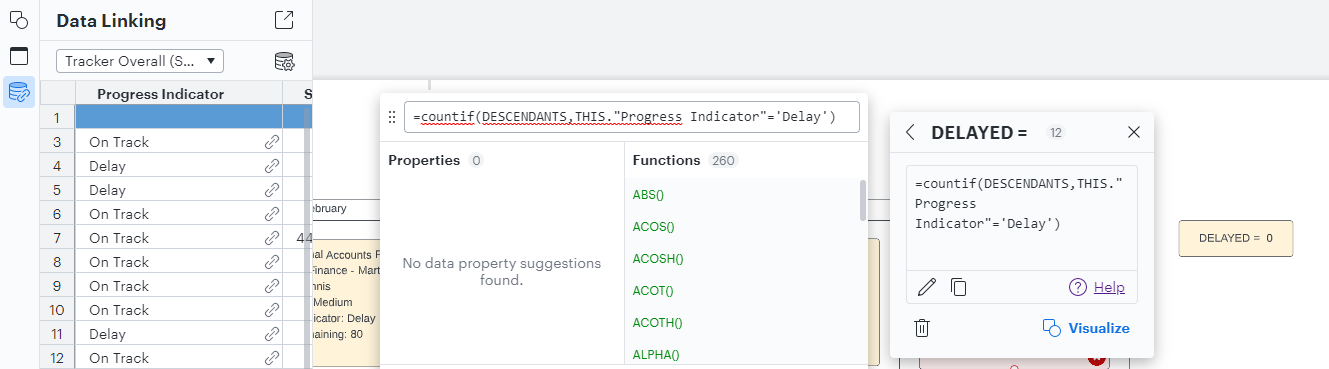
It's frustrating because the formula is getting the correct amount (12) but this is not showing in the shape. 


Hey Leon 


Thank you for posting in the Lucid Community! In order to get this number into a shape you should be able to drag a new shape onto the canvas and navigate to the right contextual panel. From there if you copy the formula that you have displayed you can paste it into a New Data Field named Property 1 which you can rename. Now you will see that there is a number associated with your formula and this number can be placed into this new shape by clicking the 3 dot menu and selecting "Insert Label as Text." I have included a short .gif that should help out along the way 😎


Please let me know if you have any other questions! Firm handshakes 🤝


Reply