Hi,
I’m very new to Lucid Chart but have watched a lot of videos to learn the basics.
My assignment is due tomorrow and I’ve been working on this thing all week so this is somewhat of an urgent need.
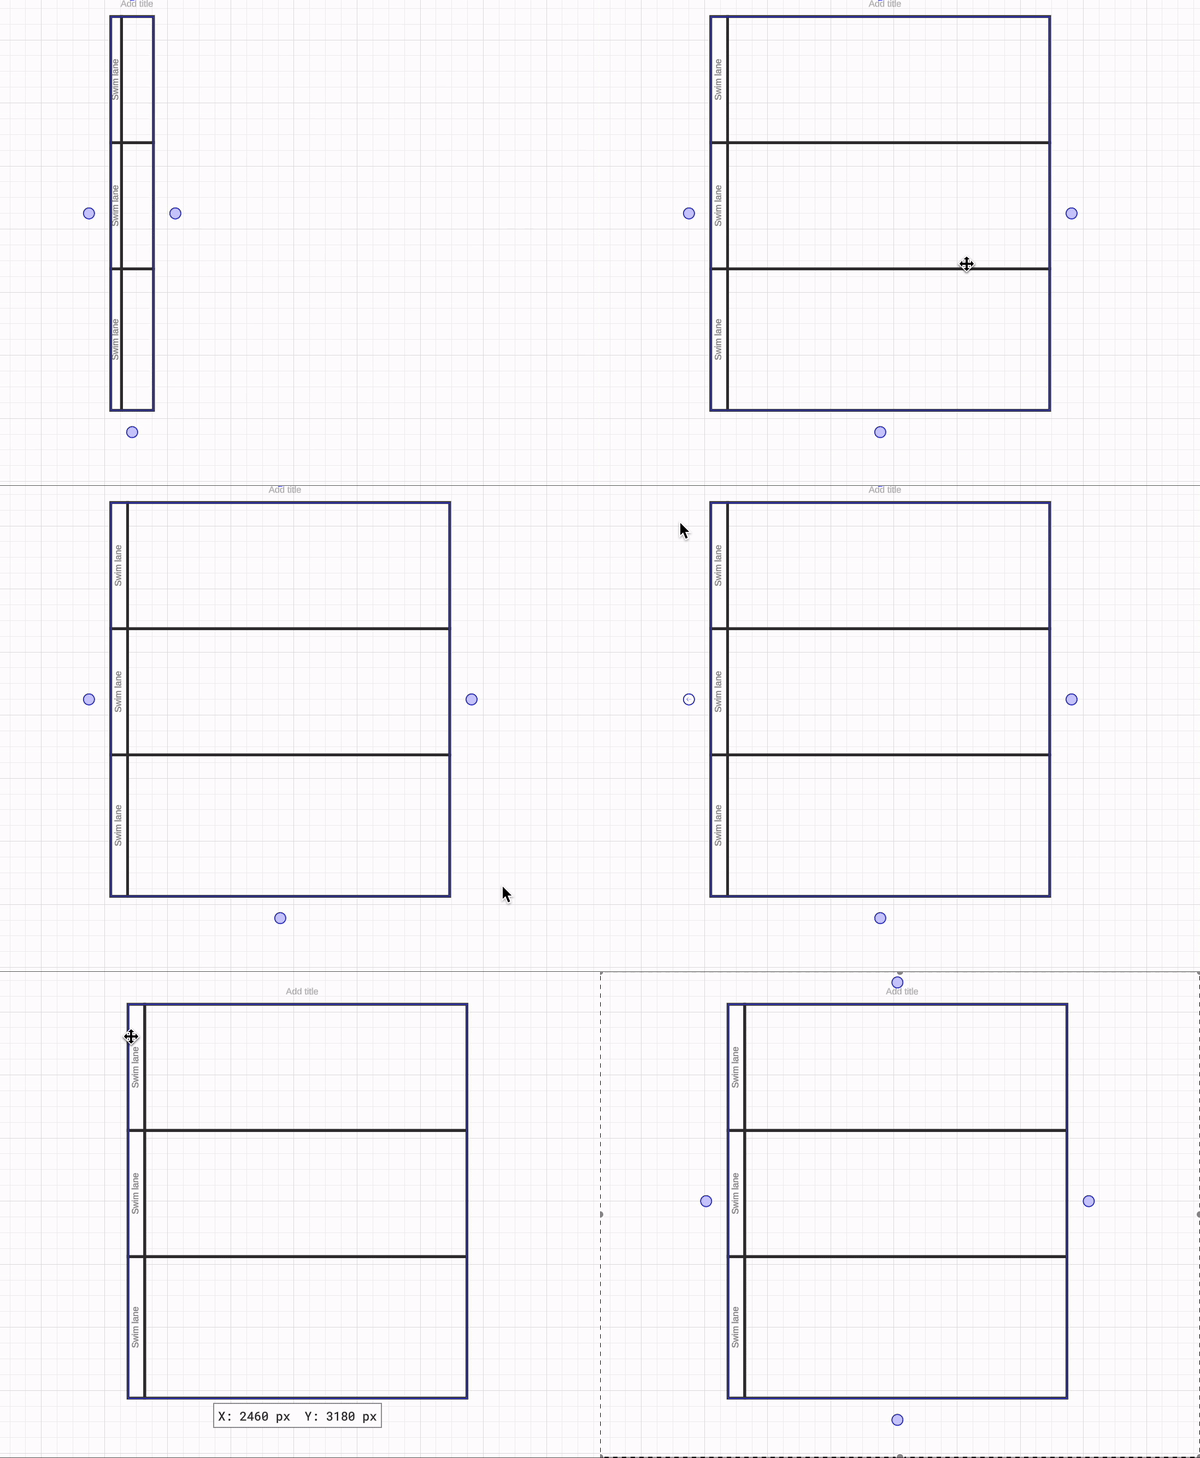
I’m currently working with swim lanes for the first time. I’m using them within my venn diagram to separate categories. I’m struggling with them and even things like, resizing, (i’m familiar with Canva, PPT, etc so know a lot of underlying logic) -- aren’t working like I’d expect. When I highlight the entire thing, it doesn’t allow me to drag edges for resizing.
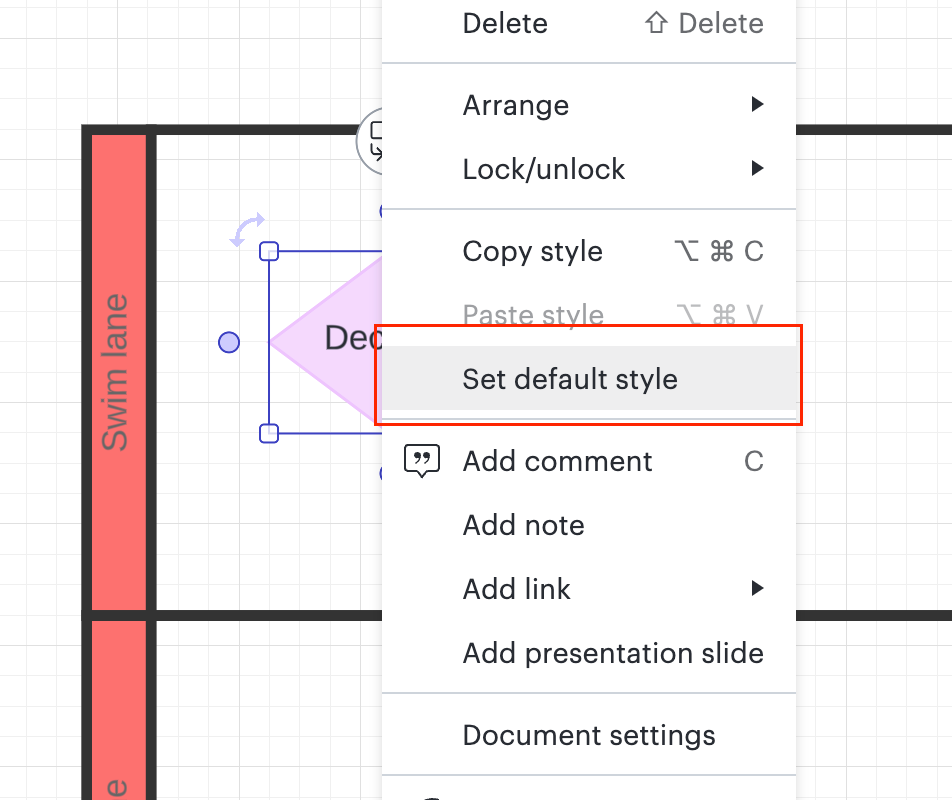
I’m also trying to streamline the colors and fonts for a given category of the swim lanes but I’m struggling there too.
Is there anyone that can walk me through this?
This part is ancillary since I kind of already gave up on it:
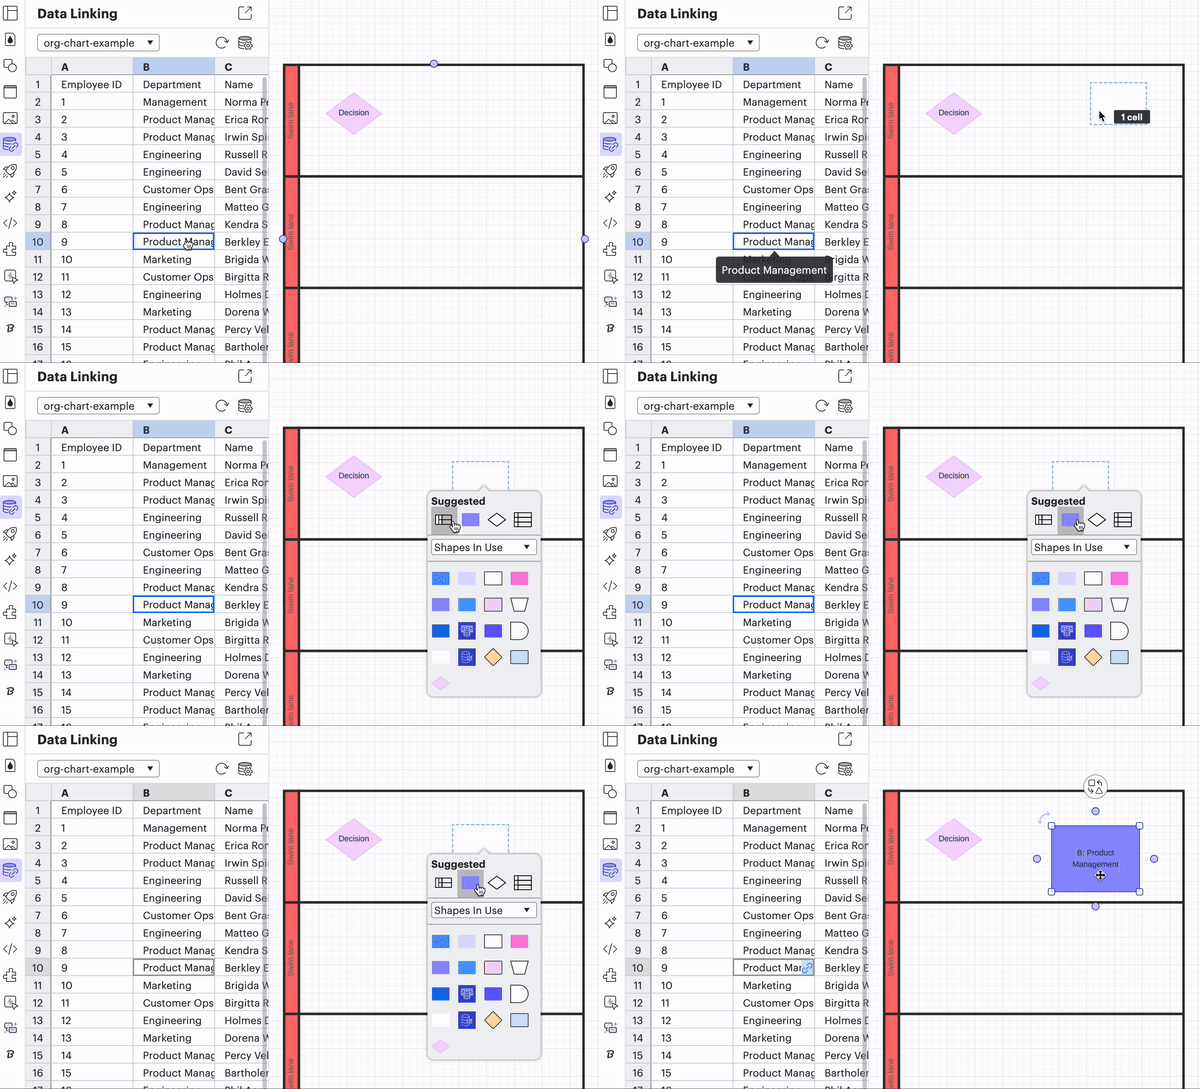
I couldn’t even get my data to upload when I was using an example of the key elements needed so I just decided to do it all individually. I spent all day yesterday trying to figure it out to no avail. Any tips there would be appreciated.
For reference, I used a .CSV file + included required columns:
- Id
- Name
- Shape Library
- Page ID
- Contained By
- Text Area 1
THANKS IN ADVANCE!
