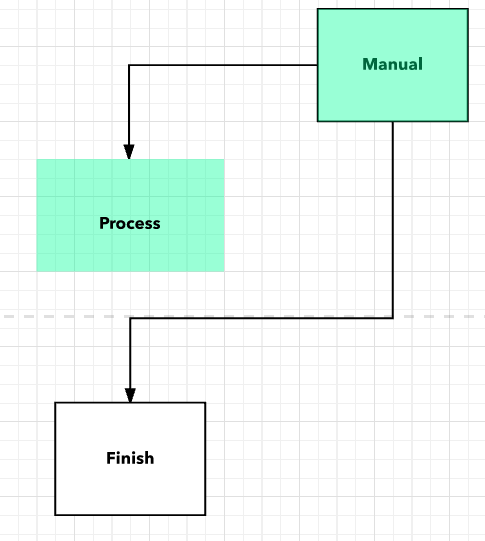
My flowchart has several rectangle shapes in the background to group different sections of the chart but when I export the chart as a PDF those rectangles disappear! Can you help me export this chart so that the exported image actually looks like the chart I've created?
Hi Alex! Those shapes are hotspots. Hotspots are action items that won't translate when downloaded as a PDF or PNG. Try deleting those hotspots and adding rectangle shapes from the shape library.
Reply
Create an account in the community
A Lucid account is required to interact with the Community, and your participation is subject to the Supplemental Lucid Community Terms. You may not participate in the Community if you are under age 18. You will be redirected to the Lucid app to log in.
Log in to the community
A Lucid account is required to interact with the Community, and your participation is subject to the Supplemental Lucid Community Terms. You may not participate in the Community if you are under age 18. You will be redirected to the Lucid app to log in.
Log in with Lucid
Enter your E-mail address. We'll send you an e-mail with instructions to reset your password.