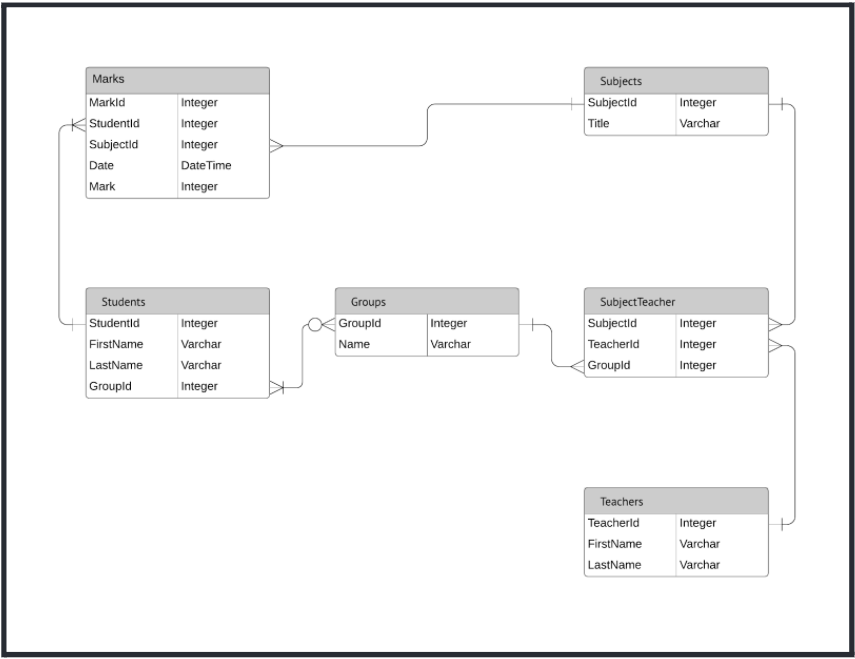
Entity Relationship diagrams allow you to represent elements of your databases visually using entities. They also allow you to represent the relationships between your databases using relationships.

In this example an ERD has been built to represent the relationships between six school databases:
- Students
- Groups
- Teachers
- Subjects
- Subject Teacher
- Marks
Each database contains information that relates to information in another database but to avoid confusion the data is organized into separate databases. Without Entity Relationship diagrams (ERDs) it can be difficult to understand what information is stored in your databases and how to use that to your benefit. ERDs set you up for success because they allow you to visualize and in turn better understand how your databases relate to each other.
Here you can find one entity shape for each database: Marks Students Groups Subjects Subject Teacher and Teachers. Beneath each entity you find various attributes or additional information that are directly related to the parent entity. These attributes correspond to columns in a database while entities correspond to rows. Notice how each student has basic attributes such as a unique student ID a first name and a last name. Each student is also a part of a group which is why you see a “GroupID” attribute under the Students entity. The same is true for the Teachers entity; each teacher has a unique ID (“TeacherID”) a first name and a last name. These entity shapes give you a basic outline of the information you can expect to find in each respective database without the need to open databases individually.
By connecting the entity shapes with these lines a simple visualization that specifically explains how the databases relate to one another has been created.
Take a look at the Groups entity in the ERD example (zoomed in below). You can see that although the Groups entity only contains two attributes (“GroupID” and “Name”) there are two lines which connect to the entity: one from the Students entity and one from the Subject Teacher entity.

You can see that both the Students and Subject Teacher entities contain an attribute called “GroupID” and the lines that connect from the “GroupID” attributes within each entity show a direct relationship to the Groups entity. In other words the lines show that the “GroupID” attributes in the Students and Subject Teacher entities are the same as the “GroupID” attribute in the Groups entity.
Additionally you can reference the cardinality guide shown in our Entity Relationship Diagrams article from the help center to determine a few important details about the relationships between these entities.
In this example the ERD shows:

- Each group has at least one student but could have more students as shown by the one or many line connection.

- Each student can be a part of zero to many groups as shown by the zero or many line connection.

- Each subject teacher has one group as shown by the one line connection.

- Each group has many subject teachers as shown by the many line connection.
Begin your work with the School ERD template from this example or check out our other ERD templates. Please follow up in the comments with any questions or examples of how you utilize ERDS to represent relationships between your databases!
