Below is what I am trying to do.
Expectation: There are 2 Smart container sets for quarter 1 and quarter 2. These need to be developed for multiple products.
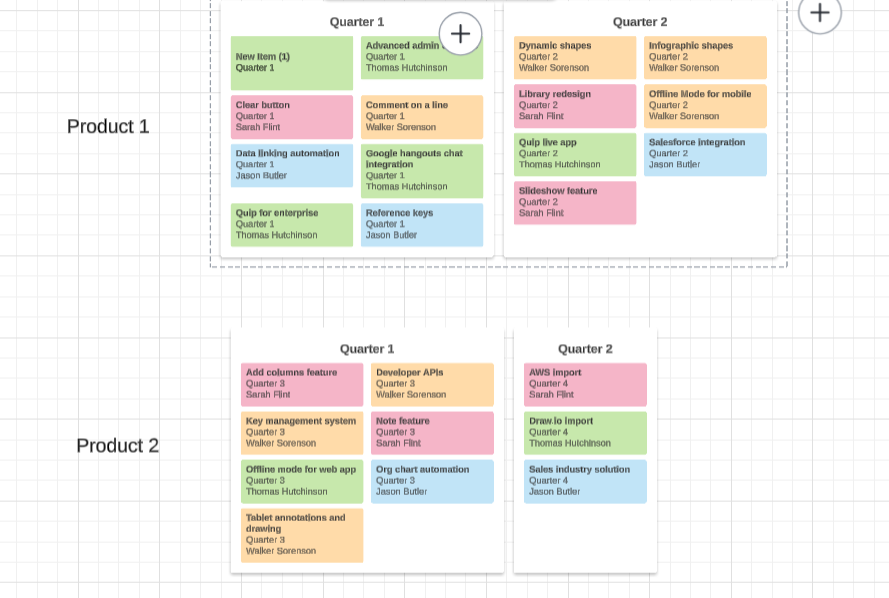
Right now i can create Quarter 1 for Product 1 alone.
 +1
+1Below is what I am trying to do.
Expectation: There are 2 Smart container sets for quarter 1 and quarter 2. These need to be developed for multiple products.
Right now i can create Quarter 1 for Product 1 alone.
Best answer by Amelia W
Hi
If I’m understanding you correctly, it sounds like you would like to only use one data source, is that correct? If you have multiple products saved within a dataset, I would recommend grouping by product, and then add the Quarter as a field to view on the card. Let me know if you have any additional questions!
A Lucid or airfocus account is required to interact with the Community, and your participation is subject to the Supplemental Lucid Community Terms. You may not participate in the Community if you are under 18. You will be redirected to the Lucid or airfocus app to log in.
A Lucid or airfocus account is required to interact with the Community, and your participation is subject to the Supplemental Lucid Community Terms. You may not participate in the Community if you are under 18. You will be redirected to the Lucid or airfocus app to log in.
Enter your E-mail address. We'll send you an e-mail with instructions to reset your password.
