Hi
I'm using data linking with Google sheets. I'm trying to get multiple fields into a single shape but this isn't working. I add one cell to the shape and that works fine the data shows up in the shape. But then when I drag another cell onto it it just replaces the first one.
According to your documentation I should get a prompt asking me if I want to replace the existing data field or keep both. But I never get that prompt the data just automatically replaces the other data. I'd like to have both data fields underneath each other. How can I do this?
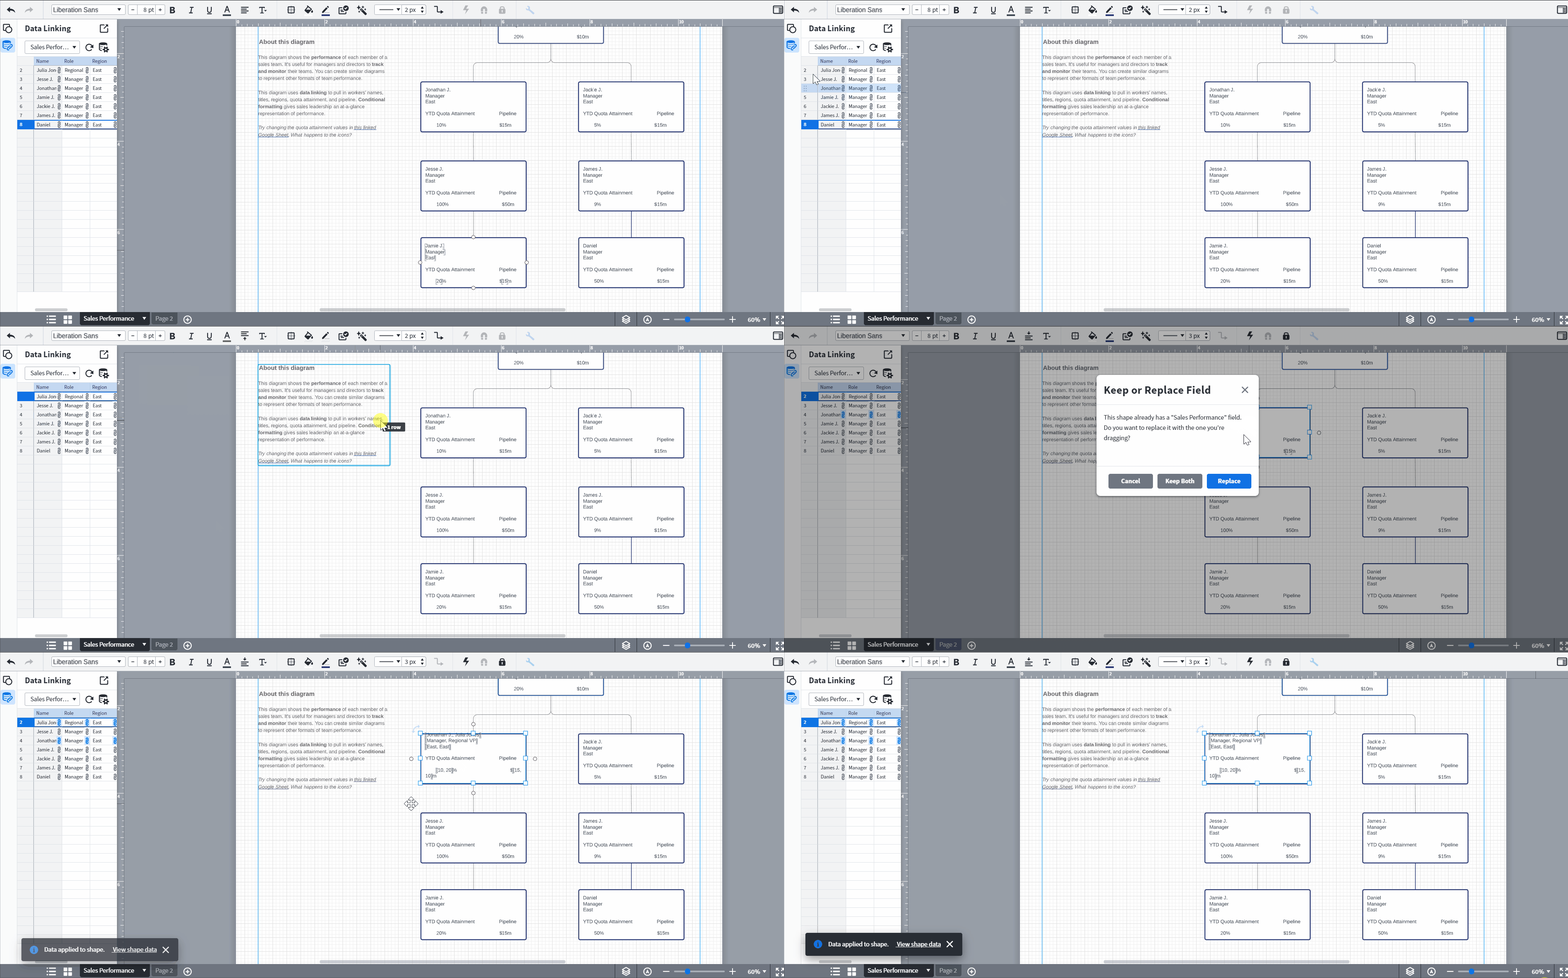
Hi Renate thanks for posting on the community! That is correct if you are using data linking you can drag a cell or a row to a shape with existing data and it will prompt a pop up that will allow you to replace the data associated with the shape or keep both. Below is a gif in which I drag out a row to a shape with existing data associated with it and opt to keep both the old and the new data.

If you are not seeing this pop up after following the steps as outlined in the gif above please submit a ticket using this form and include a screen recording of what happens when you drag the new data cell to the shape as well as the doc URL so that we can take a closer look.
For anyone else that has questions about data linking please check out our Link Google Sheet Excel or CSV Data To Lucidchart Diagrams article.
Hi! I’m Micah from Lucid’s community team. 👋 I thought you, and any others who might come across this topic in the future, might be interested in Lucid’s Data Trusted User Group. This group is made up of knowledgeable users who regularly analyze and visualize data in their work. As part of this group, you’ll have the opportunity to connect directly with Lucid’s product team, gain early access to beta features, and share insights about your needs, shaping the future of Lucid’s data solutions 🎉 You can learn more and request to join here. Thanks!
Reply
Create an account in the community
A Lucid account is required to interact with the community. You will be redirected to the Lucid app to create an account.
Log in to the community
A Lucid account is required to interact with the community. You will be redirected to the Lucid app to log in.
Login with SSO
Log in with LucidEnter your E-mail address. We'll send you an e-mail with instructions to reset your password.