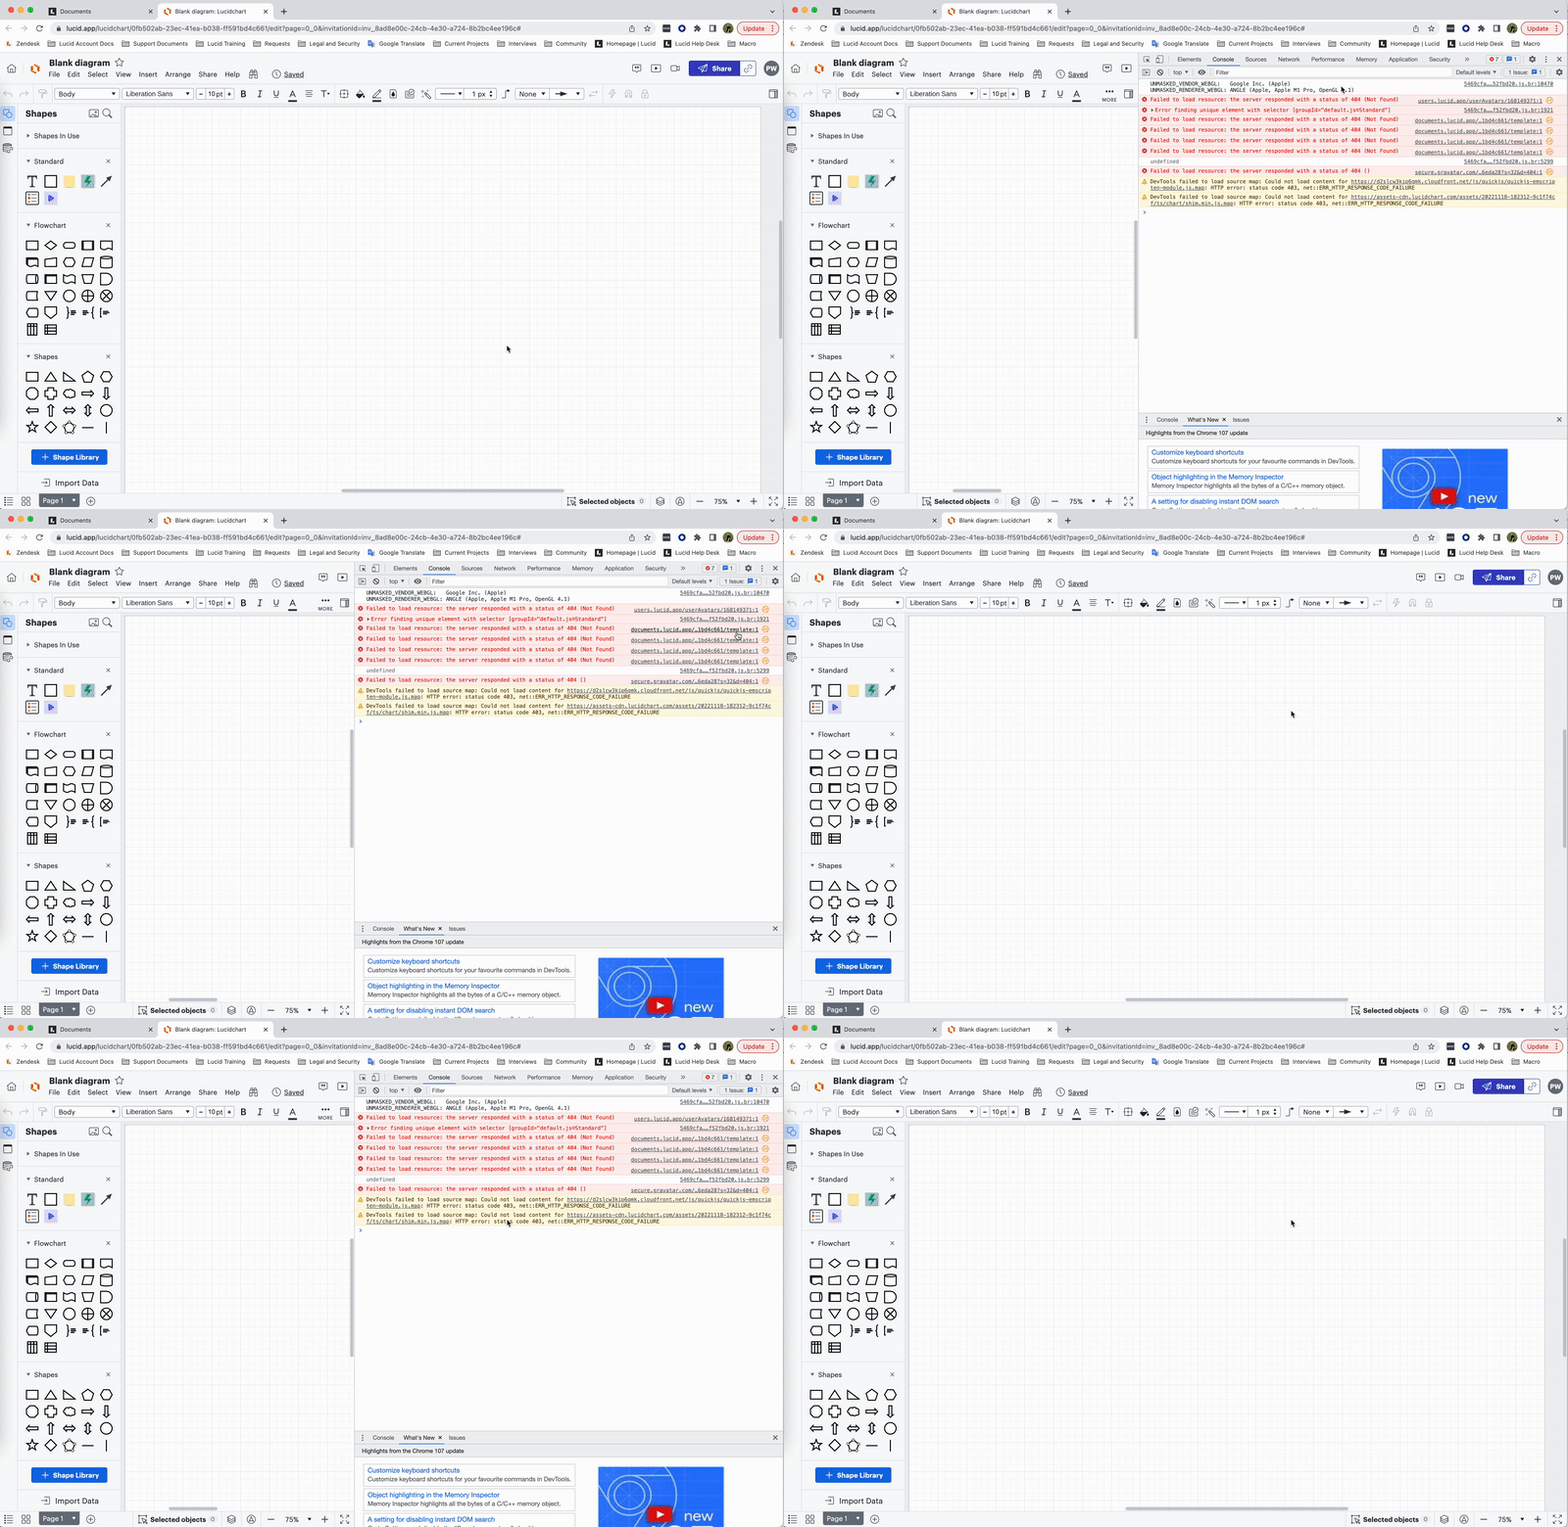
Hi! I recently submitted a support ticket and was asked to send a picture of my Javascript Console. I don't know what that is or how to get to it. Help!
Javascript Console?
Best answer by Phillip W
Hey Clifford
Thanks for posting in the Lucid Community 🥳. The Javascript Console helps debug JavaScript codes based on the browser environment or server-side environment. It basically helps us help you 😎.
You can open your Javascript Console by pressing Ctrl + Shift + J (if your computer is a Windows / Linux) OR Cmd + Opt + J (if your computer is a Mac). It can be closed either by clicking the "X" in the top-right corner of the console or by repeating the same shortcut.

Hope this helps explain--let us know if you have any other questions!
If anyone else out there is experiencing issues don't hesitate to reach out to us directly at support@lucidchart.com. We would be happy to help!
Create an account in the community
A Lucid or airfocus account is required to interact with the Community, and your participation is subject to the Supplemental Lucid Community Terms. You may not participate in the Community if you are under 18. You will be redirected to the Lucid or airfocus app to log in.
Log in to the community
A Lucid or airfocus account is required to interact with the Community, and your participation is subject to the Supplemental Lucid Community Terms. You may not participate in the Community if you are under 18. You will be redirected to the Lucid or airfocus app to log in.
Log in with Lucid Log in with airfocus
Enter your E-mail address. We'll send you an e-mail with instructions to reset your password.
