
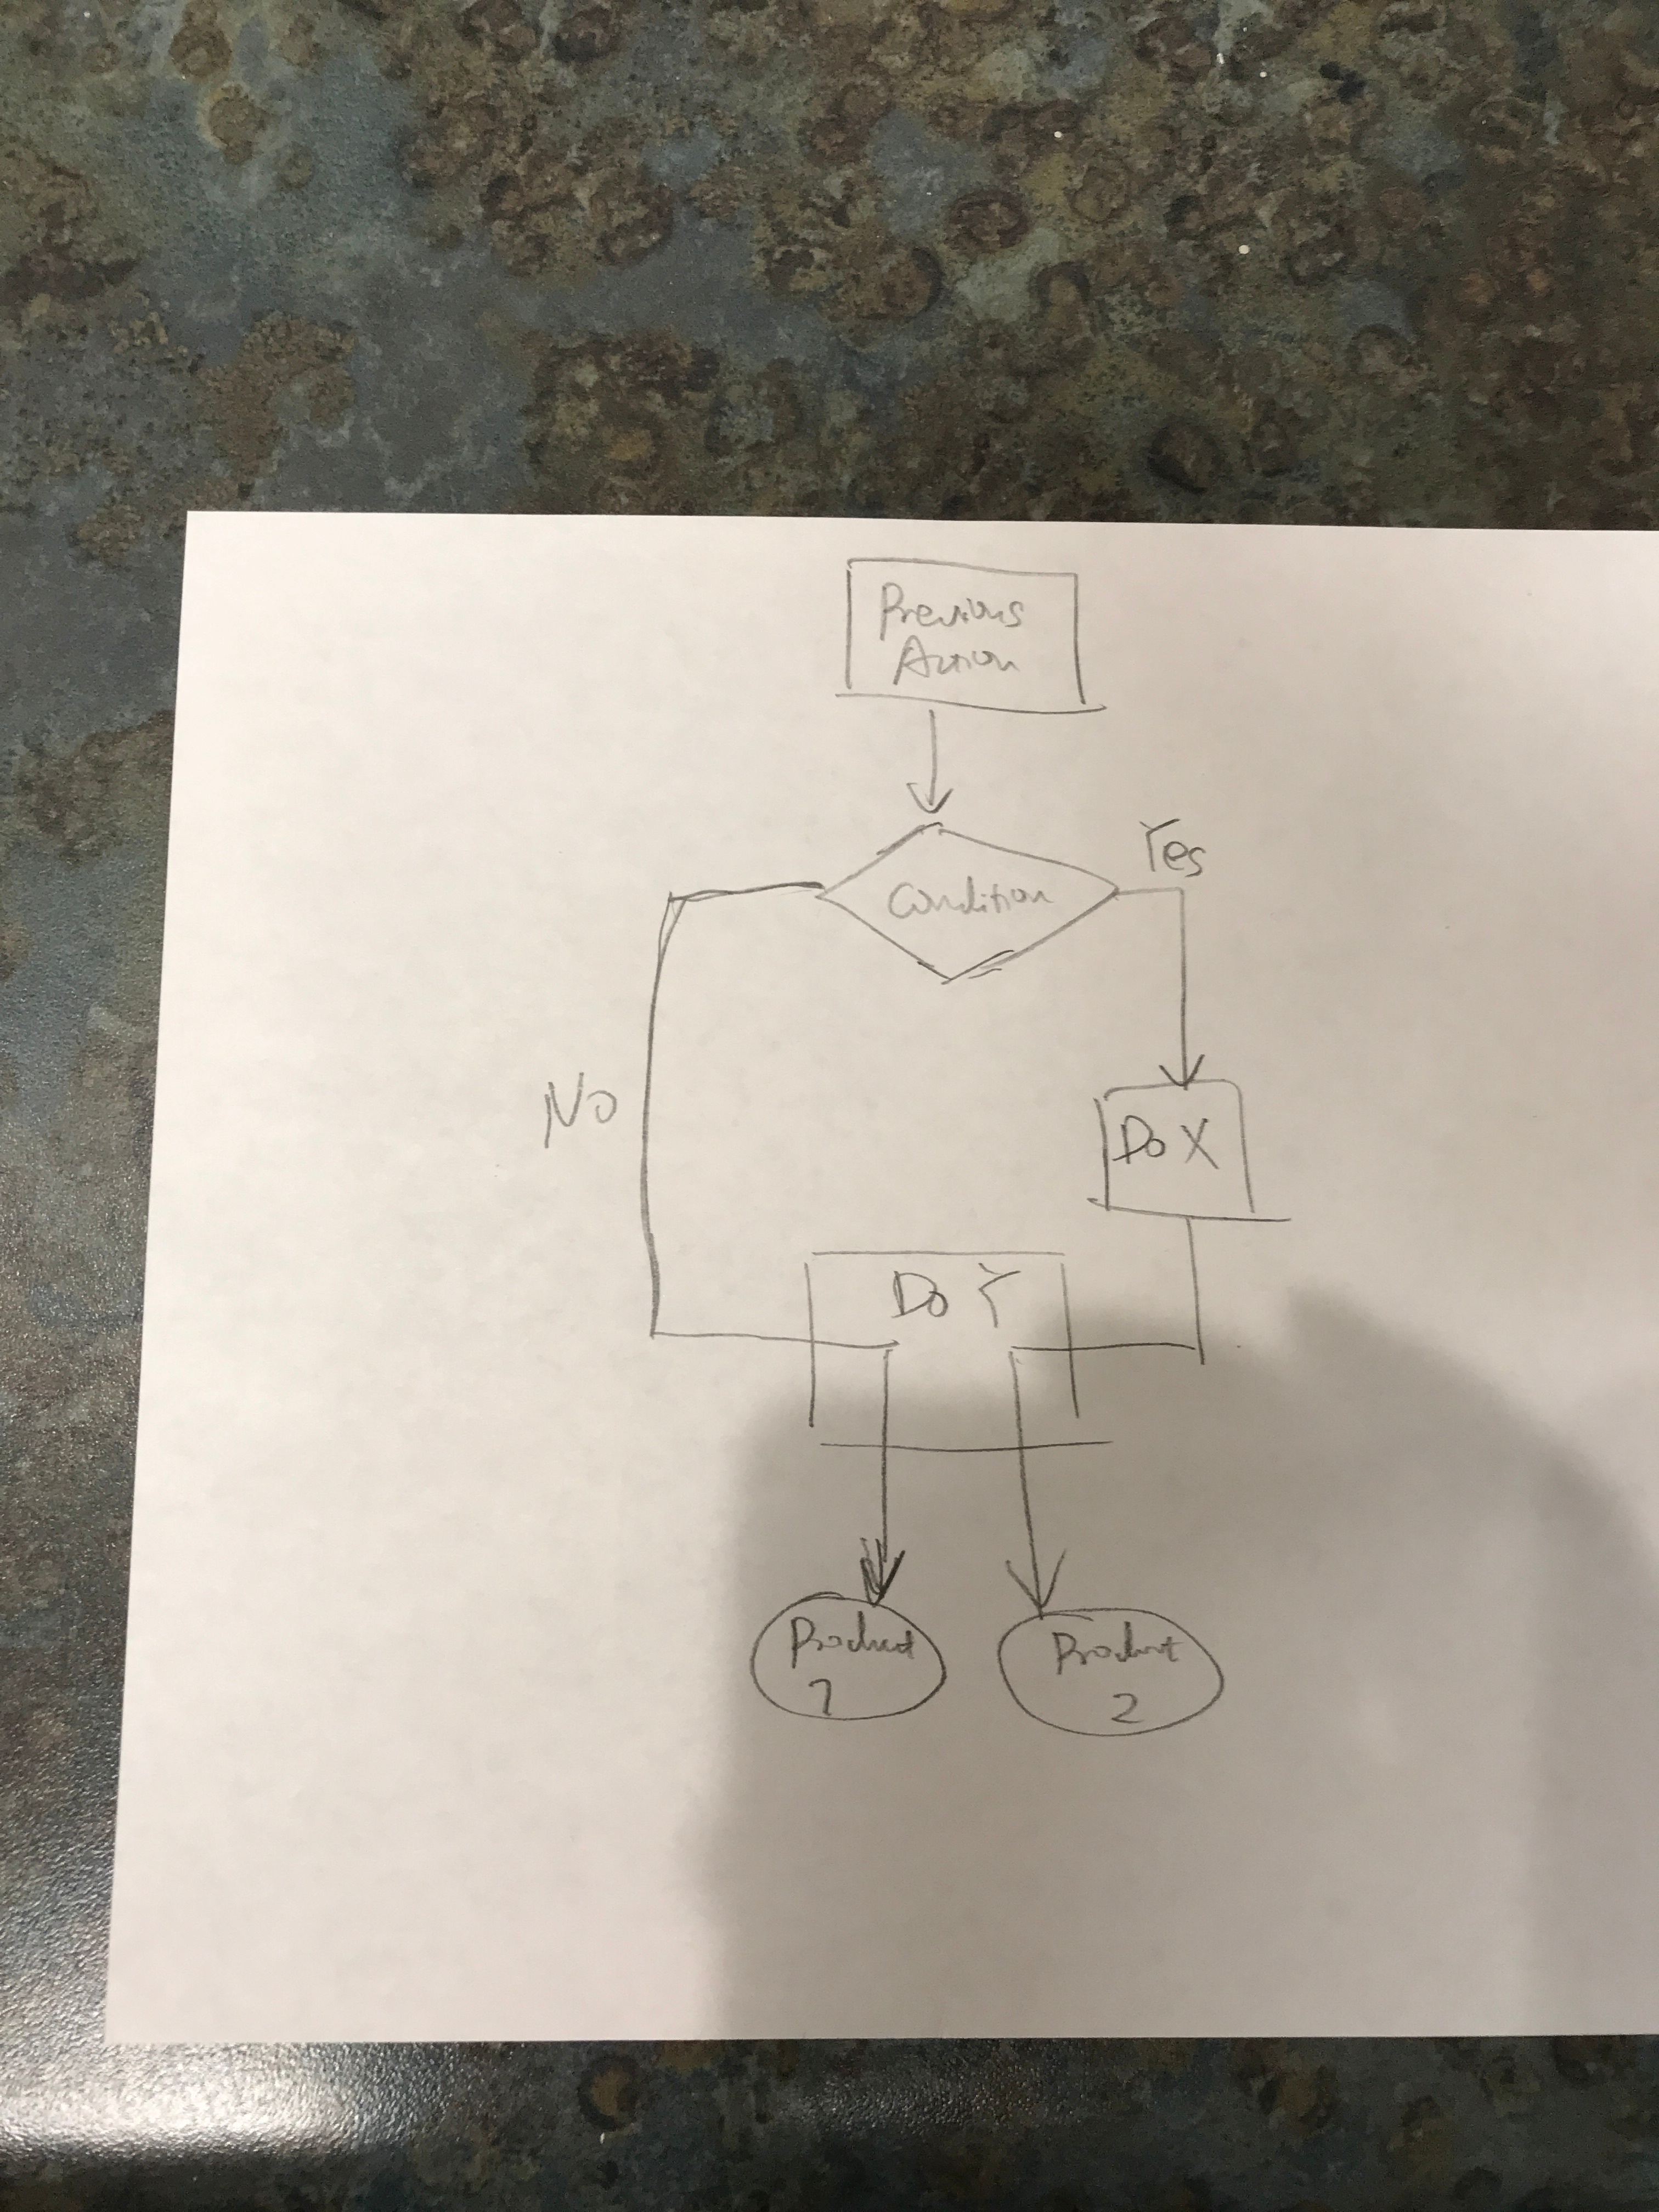
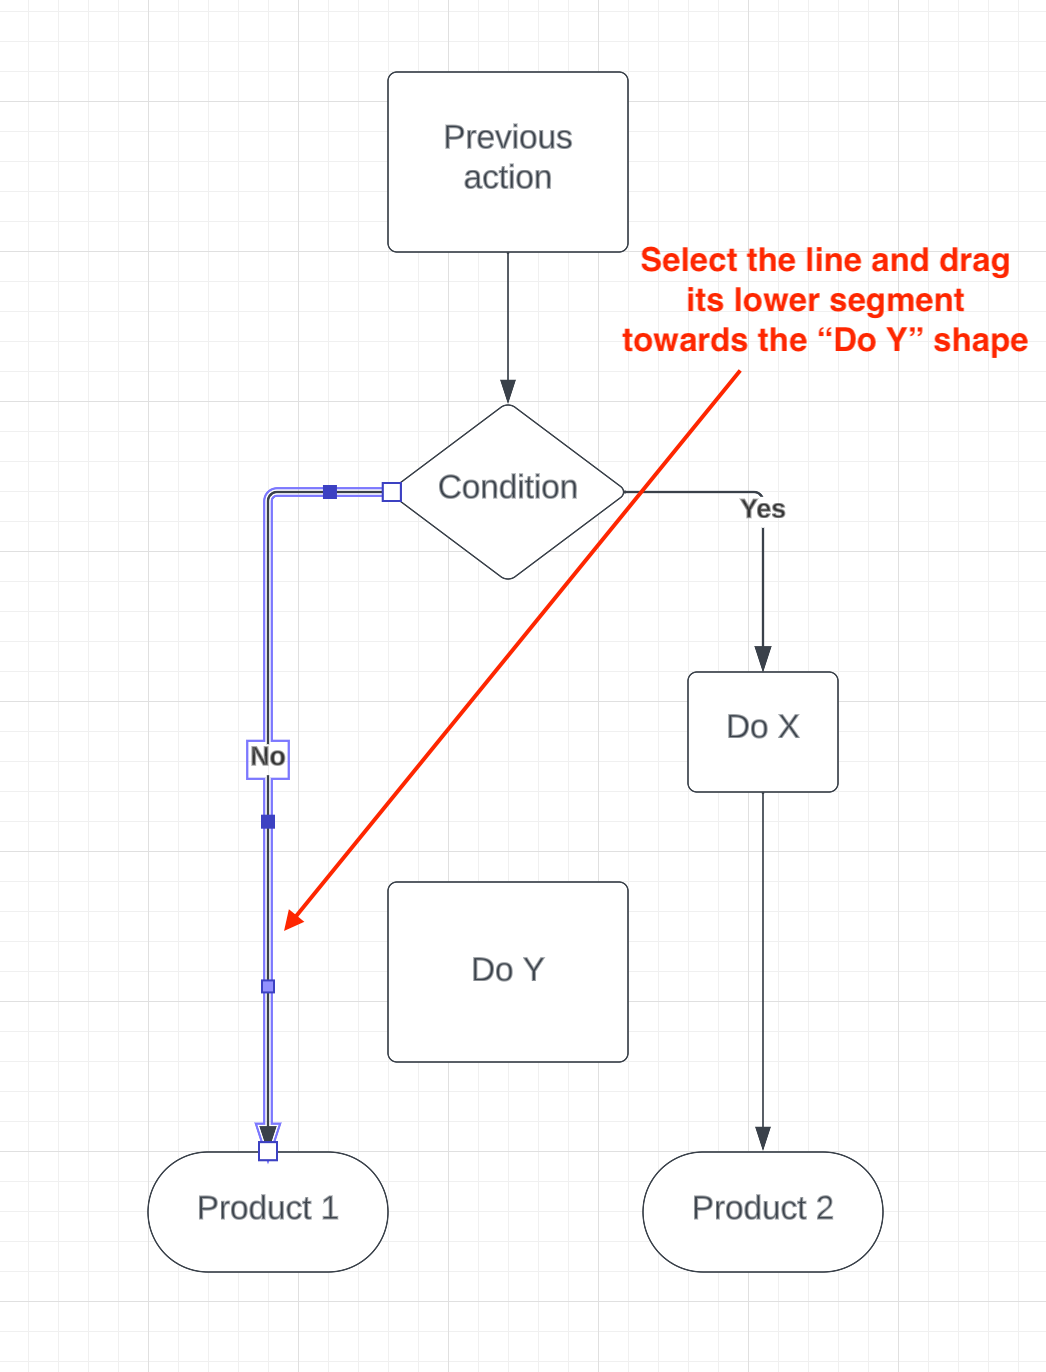
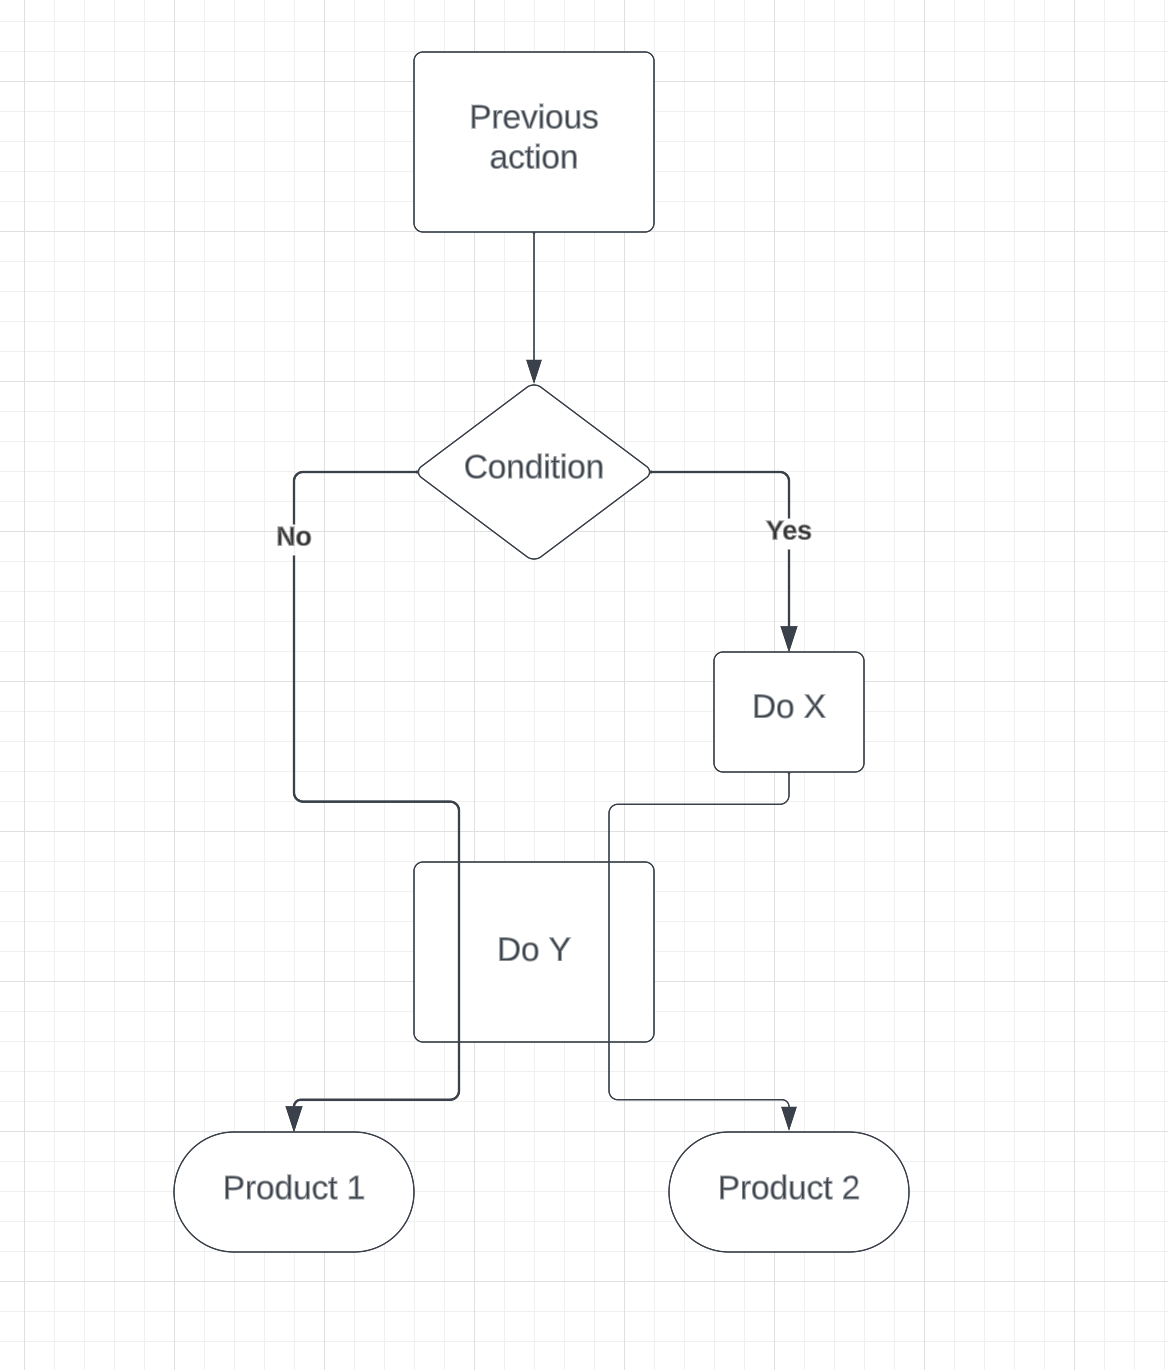
Sometimes I would like to draw a chart like something below. Is there anyway to make the line across the textbox? 


My main concern (as well as my collaborators) is that if I do not do that it is hard to tell whether product 1 is from the "No" decision or product 2. If anyone has better idea how to do that I will be appreciated as well. 


Thank you so much!


Hi Tao


Thanks for posting in the Community!


Yes that is absolutely possible! You will need to select each of the lines that represent "yes" and "no" and drag its lower segment towards the "Do Y" shape as illustrated below:


Here is the final result:


The following section of our Add and style lines in Lucidchart also explains how to modify line paths: Modify line paths


Alternatively you could also use conditional formatting rules to highlight the decision making process and have the "no" line turn red and the "yes" line turn green for example.


I hope this helps! Let me know if you have questions!


Reply