Hi Sarah
Thanks for posting in the Community!
Part of what you are trying to do is achievable with conditional formatting. With conditional formatting you will not need to select and drag a dynamic shape (such as a progress bar) from your shape panel -- instead a small progress bar will be added next to a regular shape of your choice. This is how it would look like for example: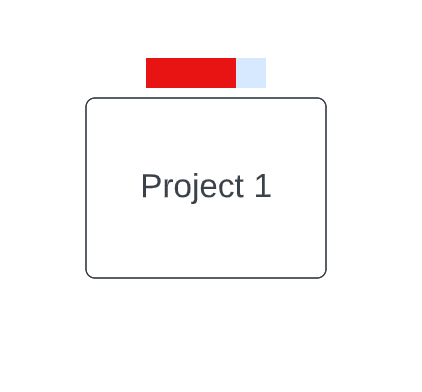
You will be able to decide where the progress bar is displayed so you could also decide to have it inside your shape: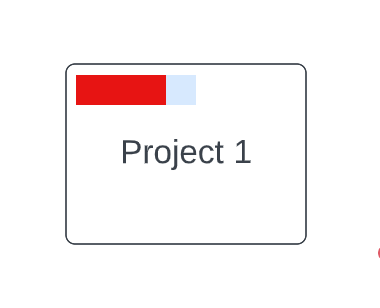
When you create a new conditional formatting rule and select dynamic shapes you’ll specify the color that fills the shape the color of the background of the shape and then specify the parameters for the value of your shape.
To show a progress bar that shows % completion on a task from 0 to 100% you could choose a custom number as the value source and type in 0 and 100 as the min and max (as shown below).
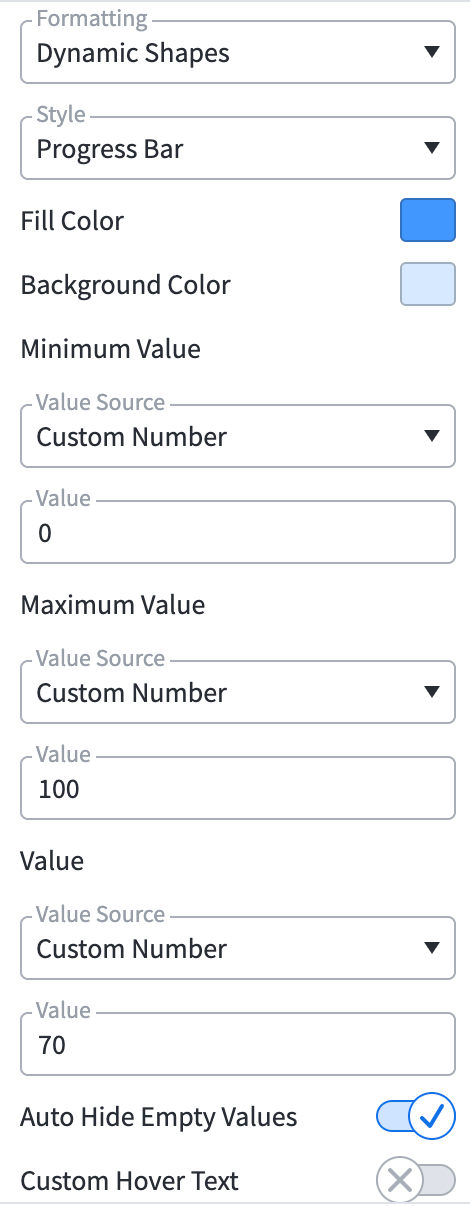
In the “Value” section select the value that you want the shape to reflect. For example if the value field contained the number 70 your progress bar will show 70% completion.
Instead of choosing “Custom number” as the value source it’s generally more helpful to use shape data and link a dataset to your shape so that the progress bar is automatically updated from your real data!
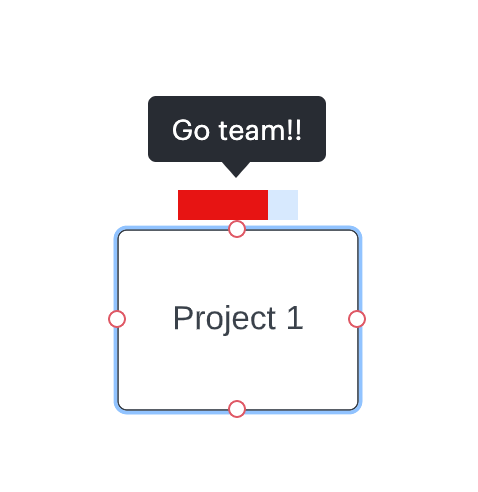
With conditional formatting the cherry on the cake is that you can also add hover text that will appear when anyone hovers over the progress bar icon as shown below:
I understand that you may not be fully satisfied with this solution as you wrote that you wanted a label showing the percentage as a number as well.
We're always looking for ways to improve Lucidchart and your feedback is the best way for us to do that. If you would like you can send an idea to the product feedback section of the community!
Ideas and comments submitted there are passed on to the product development team for their consideration. That helps them understand what users' needs and wants are and prioritize the features that are the most requested.
Thank you and of course please don't hesitate to reply here should you have any questions!
