
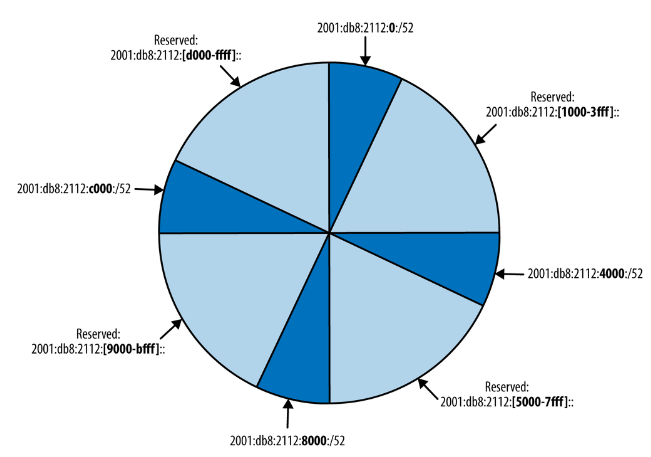
Is there a simple way to create a pie chart like the below using lucidchart? I found the lucidchart pie chart template which says to use the dynamic progress pie shape with a transparent background and then create different layers and stack them all together.


The closest i’ve been able to get using the method on the template is the below:

I can’t seem to find a way to add black borders to this dynamic shape. The usual method of clicking the shape and selecting the line style and line width doesn’t seem to work for dynamic shapes. Any guidance would be appreciated. 

Hi @sheldon.parsons, thanks for the question and apologies for the trouble. Currently there isn’t a way to add lines around a dynamic shape, but we’re very interested in your feedback and committed to continually improving our products. Feel free to add your idea to our product feedback section!

Please first search the Product Feedback section of this community (with the filter Topic Type = Idea) to see if it’s already been submitted. If so, please add any additional details you’d like and upvote the request - this consolidation helps to refine feedback and properly capture the popularity of the request.

If no one has submitted this idea yet, please create one of your own and be sure to include details about your use case or what you’d like to see in this experience. This will also allow other users with similar requests to discover and upvote it, then add details of their own. 

Finally, for more information on how Lucid manages feedback via this community, take a look at this post: 


Reply