Does anyone know when building an org chart, is there away that I’m able to see or report the exact headcount number of certain colored boxed member in the chart?
I see that someone asked very similar question 5 years ago, but I was wondering if there is new features for this matter.
Best answer by Micah
Hi @young, thank you so much for your question. Yes, this is possible by setting up some simple formulas within your document. For full documentation on formulas in Lucidchart, I recommend this resource, but I’ll detail what you’ll need specifically below.
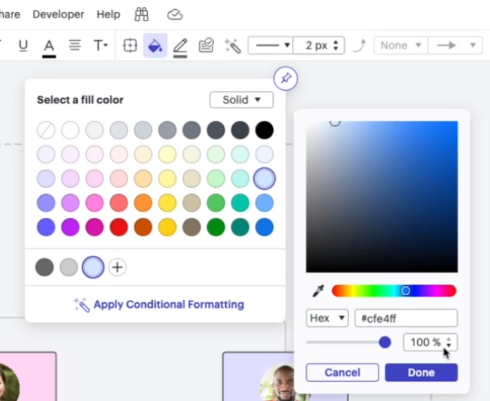
The one piece of information that you’ll need to create the formula is the Hex code of the color, which you can obtain from the color picker in the Color Fill menu.
With that information, simply use the following formula:
However, something worth noting with your org chart is that often, a color might be representative of a different attribute of the employee, such as title or location. In this case, it might be more straightforward to set up a formula to count the number of employees who already have that particular attribute within their data. Such a formula might look like:
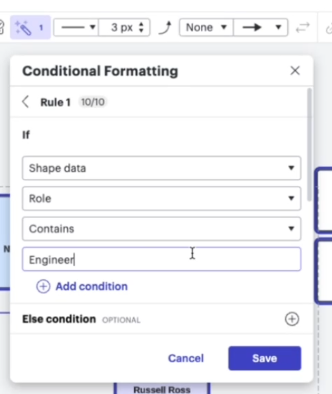
where ”Role” is the name of the data property containing an employee’s title and “Engineer” is the particular type of employee that you’re counting.
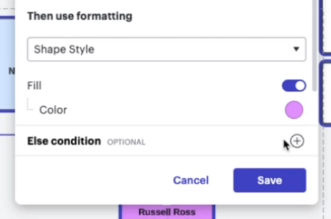
From there, if the color coding is still an important visual element of your org chart, you could automatically and dynamically apply it to your employee shapes via conditional formatting. An example of such a rule could be IF shape data “Role” contains “Engineer,” THEN apply magenta as a fill color.
I hope this helps! Please let me know if you have any additional questions.
Currently, Lucid's native capability does not support directly counting members based on box color within an org chart, which is a unique and interesting requirement.
As a potential workaround, we can explore utilizing conditional formatting in Lucidchart to highlight shapes based on color.
Though, further research and experimentation are necessary to determine if this approach will meet your needs.
In the meantime, I suggest submitting this idea to Lucid internal team for consideration by adding it to the ideas tag. This will allow them to explore and prioritize this feature request for future development.
Hi @young, thank you so much for your question. Yes, this is possible by setting up some simple formulas within your document. For full documentation on formulas in Lucidchart, I recommend this resource, but I’ll detail what you’ll need specifically below.
The one piece of information that you’ll need to create the formula is the Hex code of the color, which you can obtain from the color picker in the Color Fill menu.
With that information, simply use the following formula:
However, something worth noting with your org chart is that often, a color might be representative of a different attribute of the employee, such as title or location. In this case, it might be more straightforward to set up a formula to count the number of employees who already have that particular attribute within their data. Such a formula might look like:
where ”Role” is the name of the data property containing an employee’s title and “Engineer” is the particular type of employee that you’re counting.
From there, if the color coding is still an important visual element of your org chart, you could automatically and dynamically apply it to your employee shapes via conditional formatting. An example of such a rule could be IF shape data “Role” contains “Engineer,” THEN apply magenta as a fill color.
I hope this helps! Please let me know if you have any additional questions.
A Lucid or airfocus account is required to interact with the Community, and your participation is subject to the
Supplemental Lucid Community Terms.
You may not participate in the Community if you are under 18. You will be redirected to the Lucid or airfocus app to log in.
A Lucid or airfocus account is required to interact with the Community, and your participation is subject to the
Supplemental Lucid Community Terms.
You may not participate in the Community if you are under 18. You will be redirected to the Lucid or airfocus app to log in.