
A cloud outage is always a source of inconvenience and stress but being able to determine the cause quickly can keep an outage from causing bigger problems. These steps will help you use Lucidscale to generate cloud documentation that will help you troubleshoot a cloud outage.
- Import your architecture into the Data Hub. Navigate to the left-side panel in Lucidscale and select “Import Data'' to pull in cloud provider metadata and get an accurate picture of your current state. Lucidscale works with AWS Azure and GCP. For more detailed instructions check out our Help Center article on importing your data.
- Create new model in Lucidscale. Auto-generate a model from your imported data. You’ll be able to apply filters customize views show connected resources and more.
- Troubleshoot with custom views. Use existing views or create custom views to hone in on the part of your cloud infrastructure you’re checking for issues by adding filters lines and conditional formatting rules.
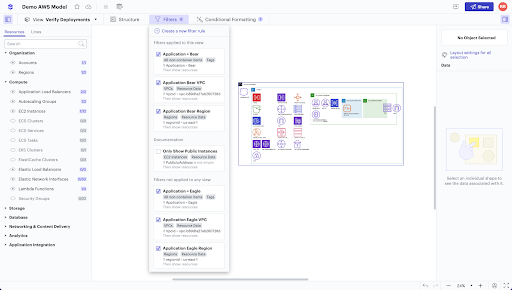
Use filters to focus on areas you think might be the cause of the outage or declutter your diagram by filtering out resources that you have confirmed aren’t the problem. Toggle lines on and off to verify that resources are connected correctly and that no connections are missing.
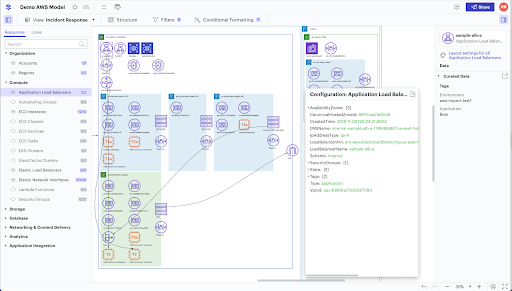
Look for resources that are configured incorrectly with quick easy-to-use conditional formatting rules that can target any piece of metadata.
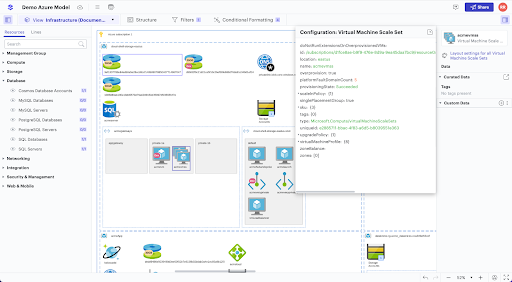
4. Access key data. Access key data through the Lucidscale data panel to avoid going back and forth between the model and your client’s cloud provider console.
5. Prepare for future outages. Keep your data source up to date in the Lucidscale Data Hub so your cloud architecture models are always as accurate as possible. This will help with incident response if another outage occurs. If you’re ready to propose updates and improvements see how our suite of tools is more powerful together.