Very simple yet difficult- I have something which i built. For example a lab diagram. All i want is to have square around it. But it is covering the diagram i just did. Why this simple thing is so hard? I couldn't find it..
Page 1 / 1
Hi Dolev thanks for posting in the community! There are two different ways you can add a square around your diagram:
- Change the positioning of the square. To do this move the square on top of the diagram you would like to add the square to Right-click > Arrange > Send to back.
- Change the fill colour of the square. Select a shape you would like to use and click the colour bucket along the toolbar on the top of the editor. You can select to have no-fill for your shape this way you should be able to see our diagram underneath it.
Please take a look at the attached GIF to see this in action. Let me know if you have any questions hope this helps!
Thanks!
Hi
Still an issue. The use case is- I inserted an image. In this image all I want to do is to draw a square/circle/etc. arounf specific item in the image.
Is it possible??
Thanks
Ok just found it. Send to back is not good enough as it will send also the square completely.
Hi @dolev s thanks for continuing this thread I'm glad to hear you were able to add a square around your image!
If 'Send to back' does not work for your use case I would recommend changing the fill colour of the square to transparent so that your image can be seen underneath the shape. To see the two options in action one after another please watch the GIF attached to my comment above.
Please don't hesitate to let us know if you have any additional questions - we are happy to help!
Hi adding to this because I still can't find a workaround. Basically I start with a diagram that looks like this:
But I want to enclose part of that diagram in a dashed box for emphasis. See the red dashed box added here:
This is with the opacity of the red box turned down a bit. But there's no way to make the inside of the box transparent without also making the border of the box transparent. In powerpoint I can get the desired effect by setting the fill style to "no fill".
Btw when I tried to attach images to this post but I just get a message saying the format is wrong or the size is too big even though they're pngs with size around 20kb... might want to fix that too.
Regards
Mike
Hi @mike t101 thank you for continuing this thread - I'm happy to help!
It is possible to set the fill colour of your object to be transparent. To do this first select the object and click the 'Fill Colour' option in the tool bar. From the list of colours please select the top left option (the colour with a line crossed through it) - this should be #000000.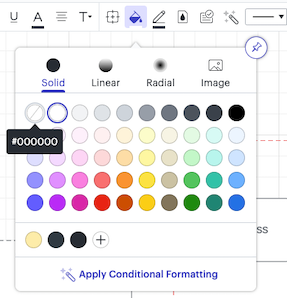
Once you have selected this colour the fill colour of your shape should be transparent allowing you to add the shape to your diagram like the second screenshot example you shared. You may also find the layers feature useful in creating a diagram that requires objects to overlap one another.
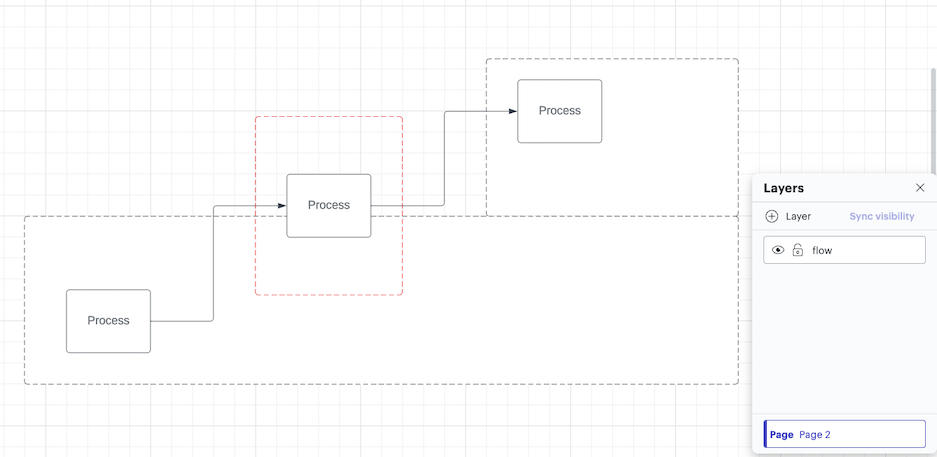
For example I created the following diagram and added a red frame with transparent fill around the middle shape similar to your example. I also moved all my process shapes and lines onto another layer named 'flow'. This feature can help with adding frame/boarders around your objects without needing to rearrange them using the 'Send to back' option.
I hope this helps. Please feel free to let me know if you have any questions!
Reply
Create an account in the community
A Lucid account is required to interact with the community. You will be redirected to the Lucid app to create an account.
Log in to the community
A Lucid account is required to interact with the community. You will be redirected to the Lucid app to log in.
Log in with Lucid
or
Enter your E-mail address. We'll send you an e-mail with instructions to reset your password.