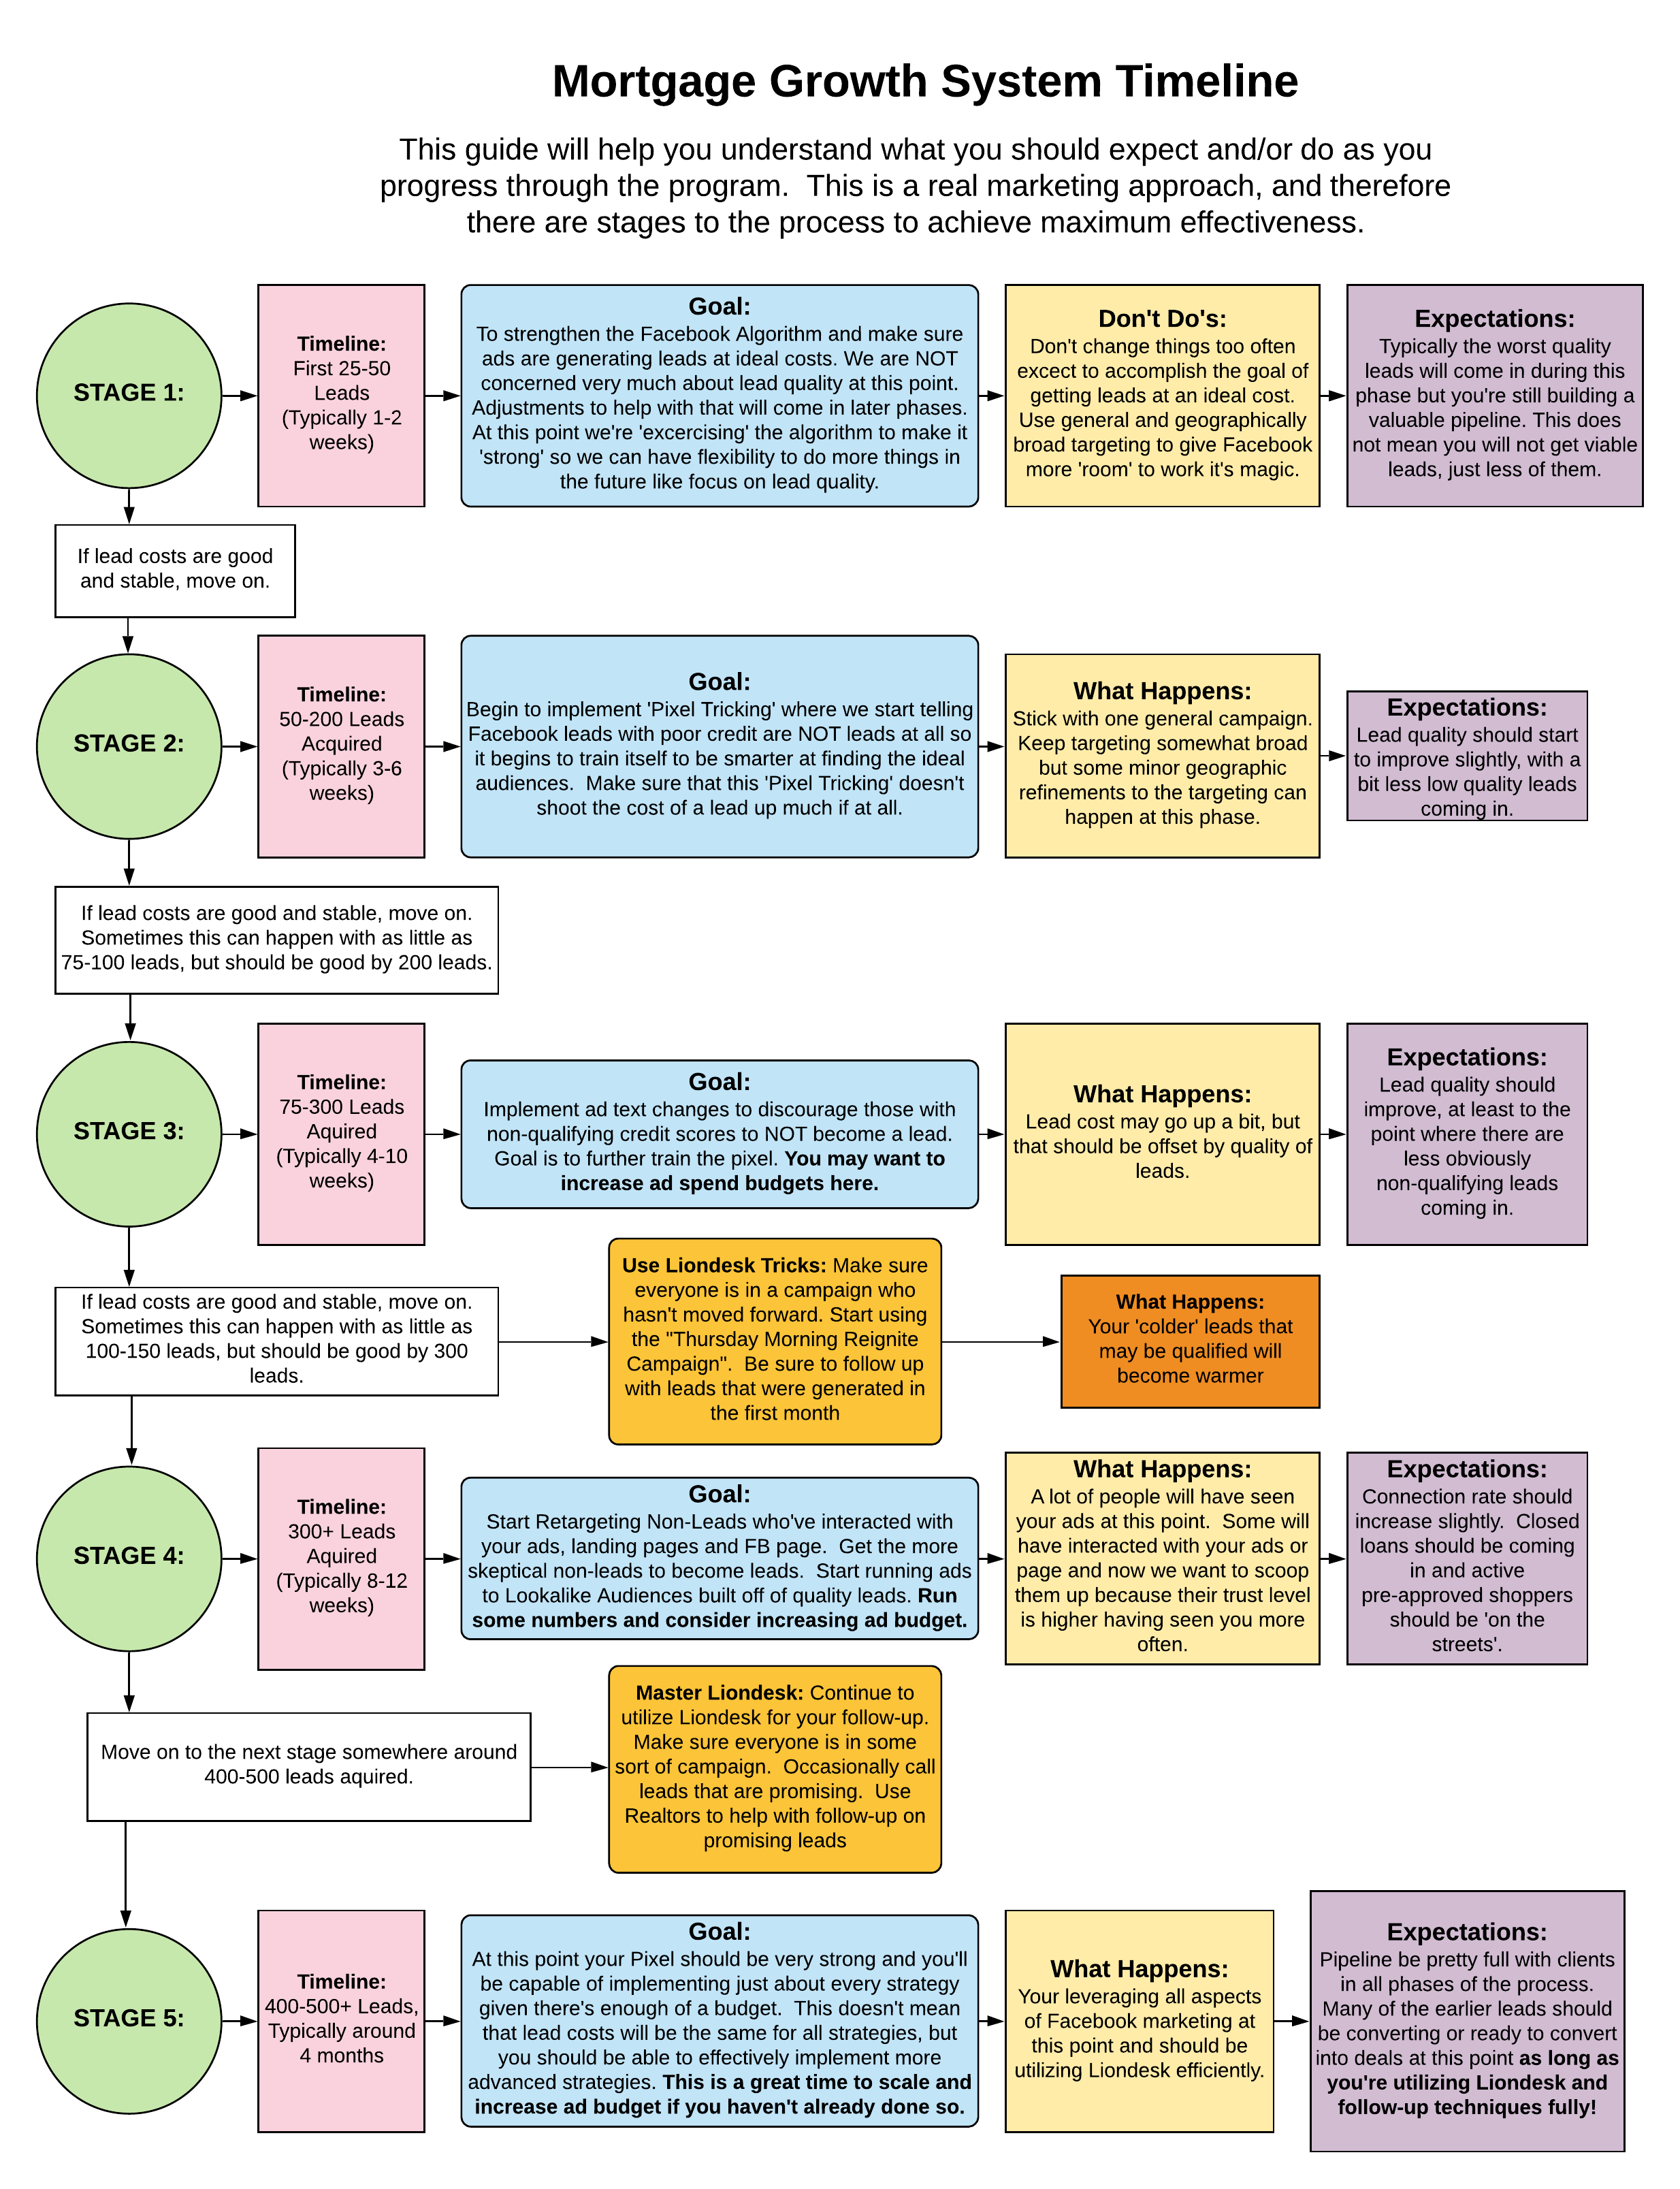
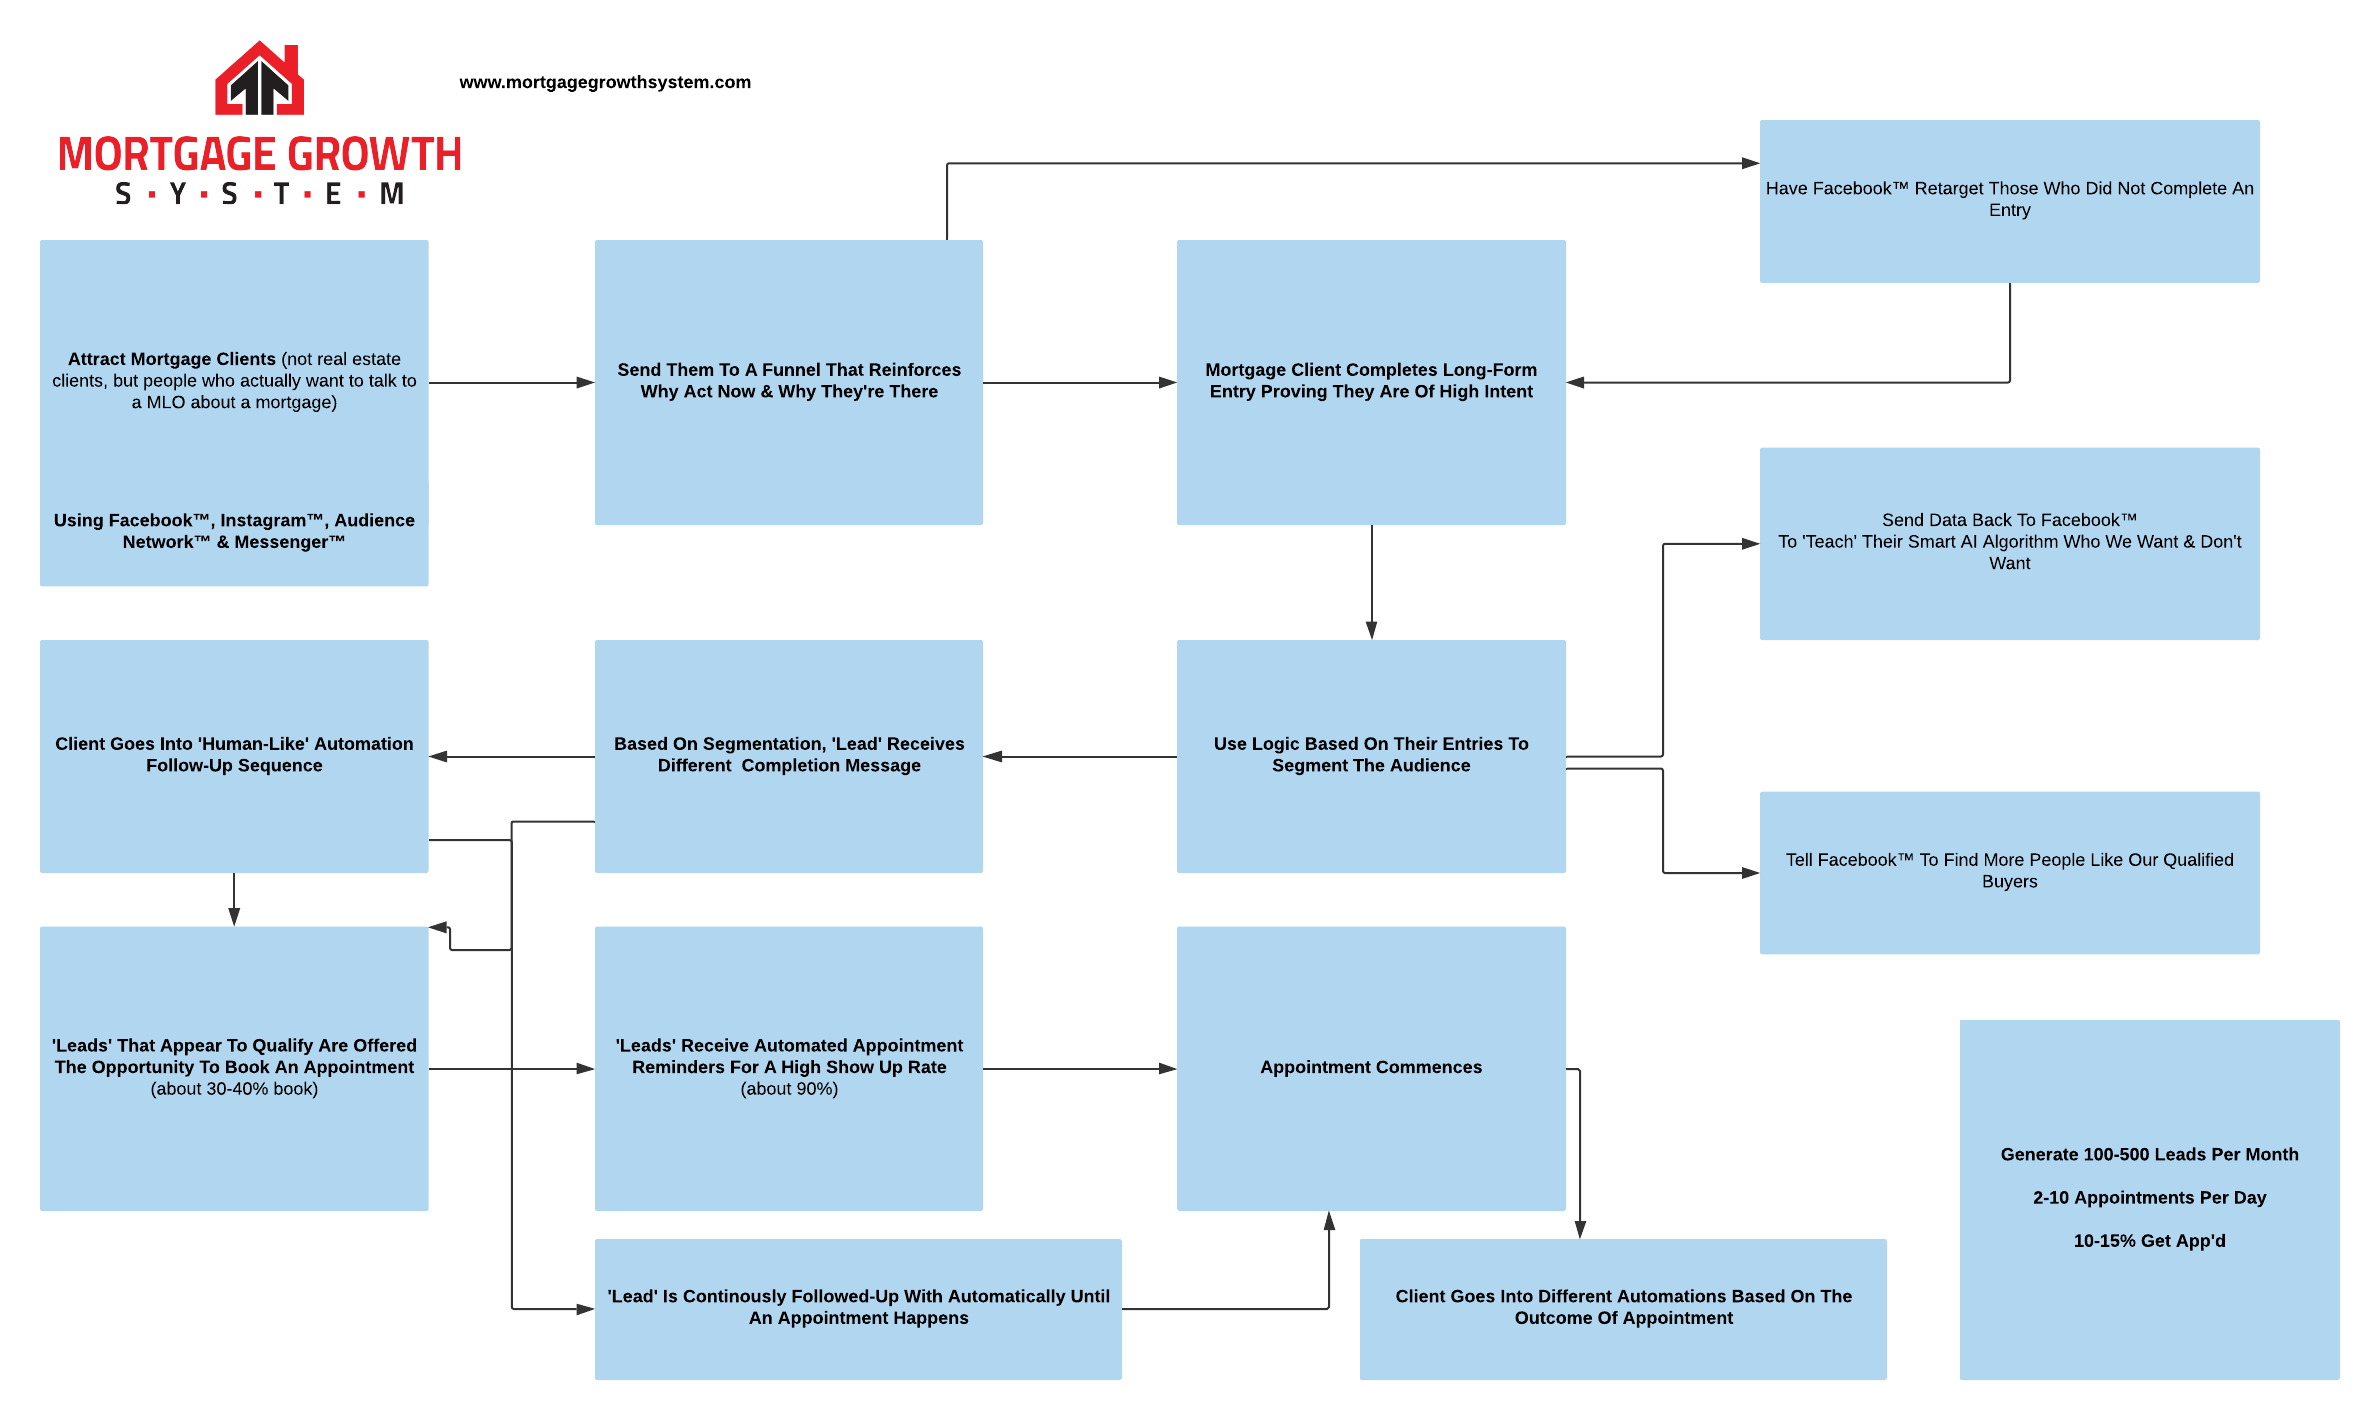
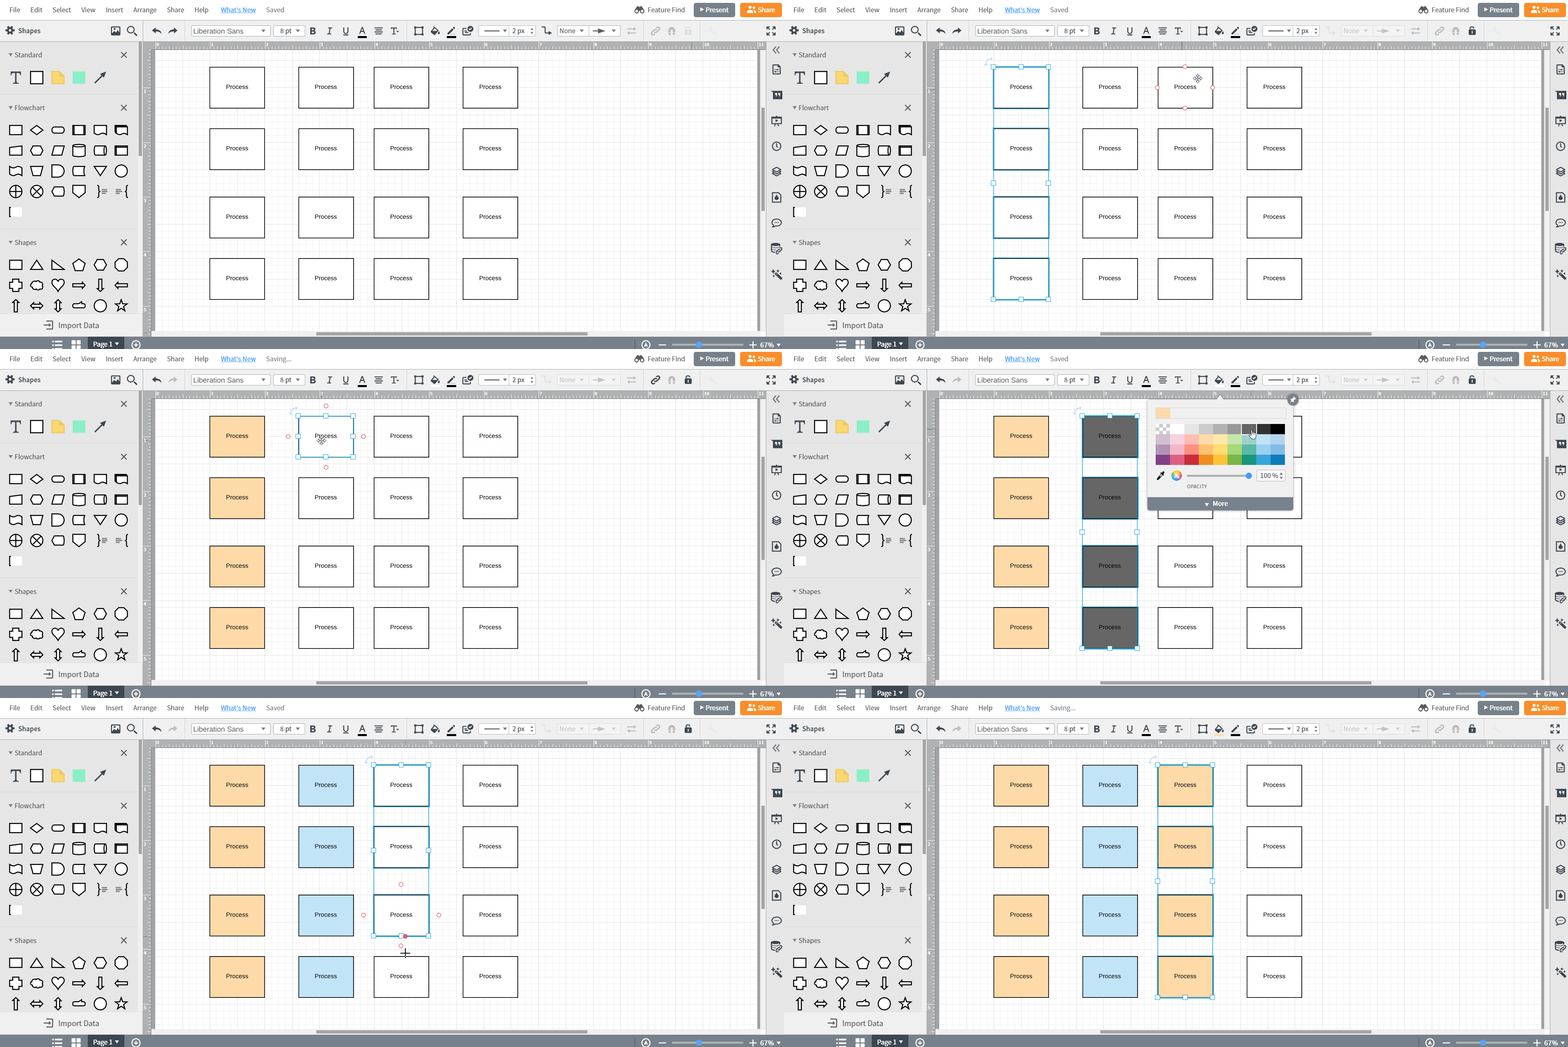
I was working in chart and somehow hit a button which I didn't even realize I hit or know what button it was and it totally transformed my chart from color to all blue. Does anyone know how to reverse this? I have a picture of the chart attached (all blue) and a different chart but with the same type of color formatting I actually want for the chart that is all blue now. 

Hit One Button & It Totally Changed Everything
Create an account in the community
A Lucid or airfocus account is required to interact with the Community, and your participation is subject to the Supplemental Lucid Community Terms. You may not participate in the Community if you are under 18. You will be redirected to the Lucid or airfocus app to log in.
Log in to the community
A Lucid or airfocus account is required to interact with the Community, and your participation is subject to the Supplemental Lucid Community Terms. You may not participate in the Community if you are under 18. You will be redirected to the Lucid or airfocus app to log in.
Log in with Lucid Log in with airfocus
or
Enter your E-mail address. We'll send you an e-mail with instructions to reset your password.
