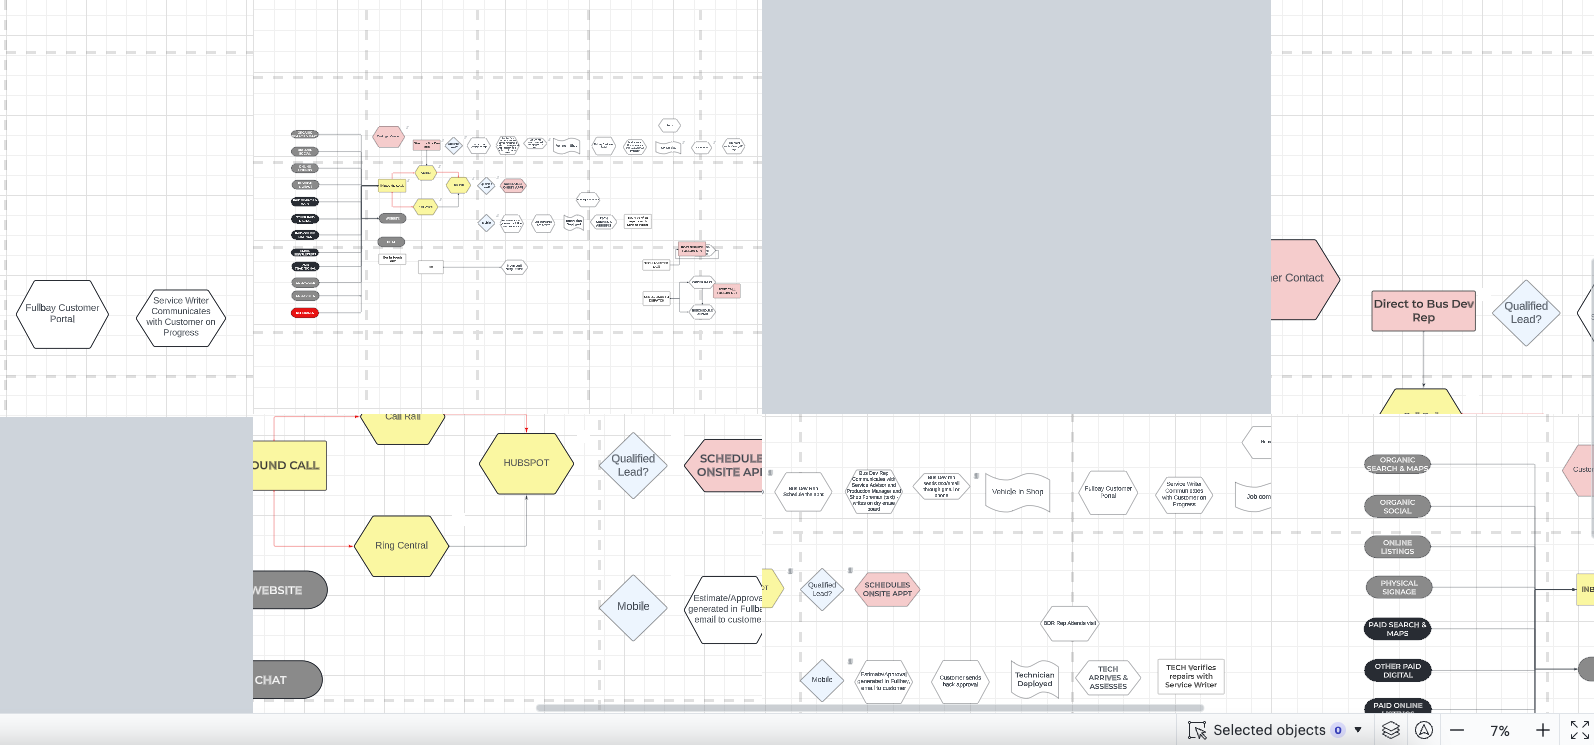
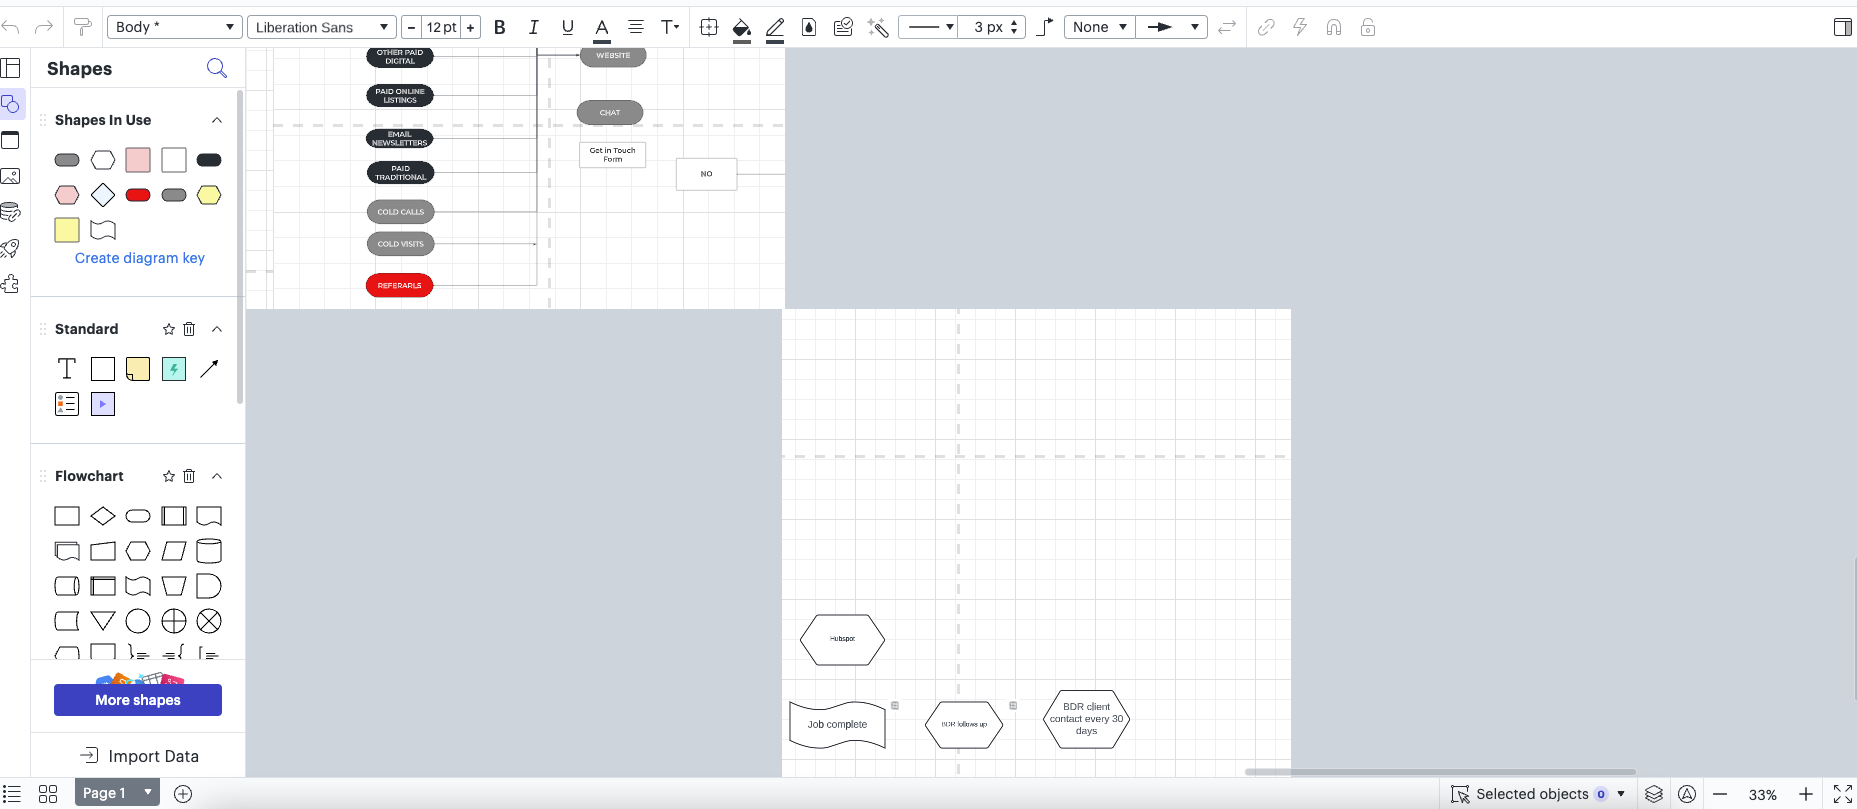
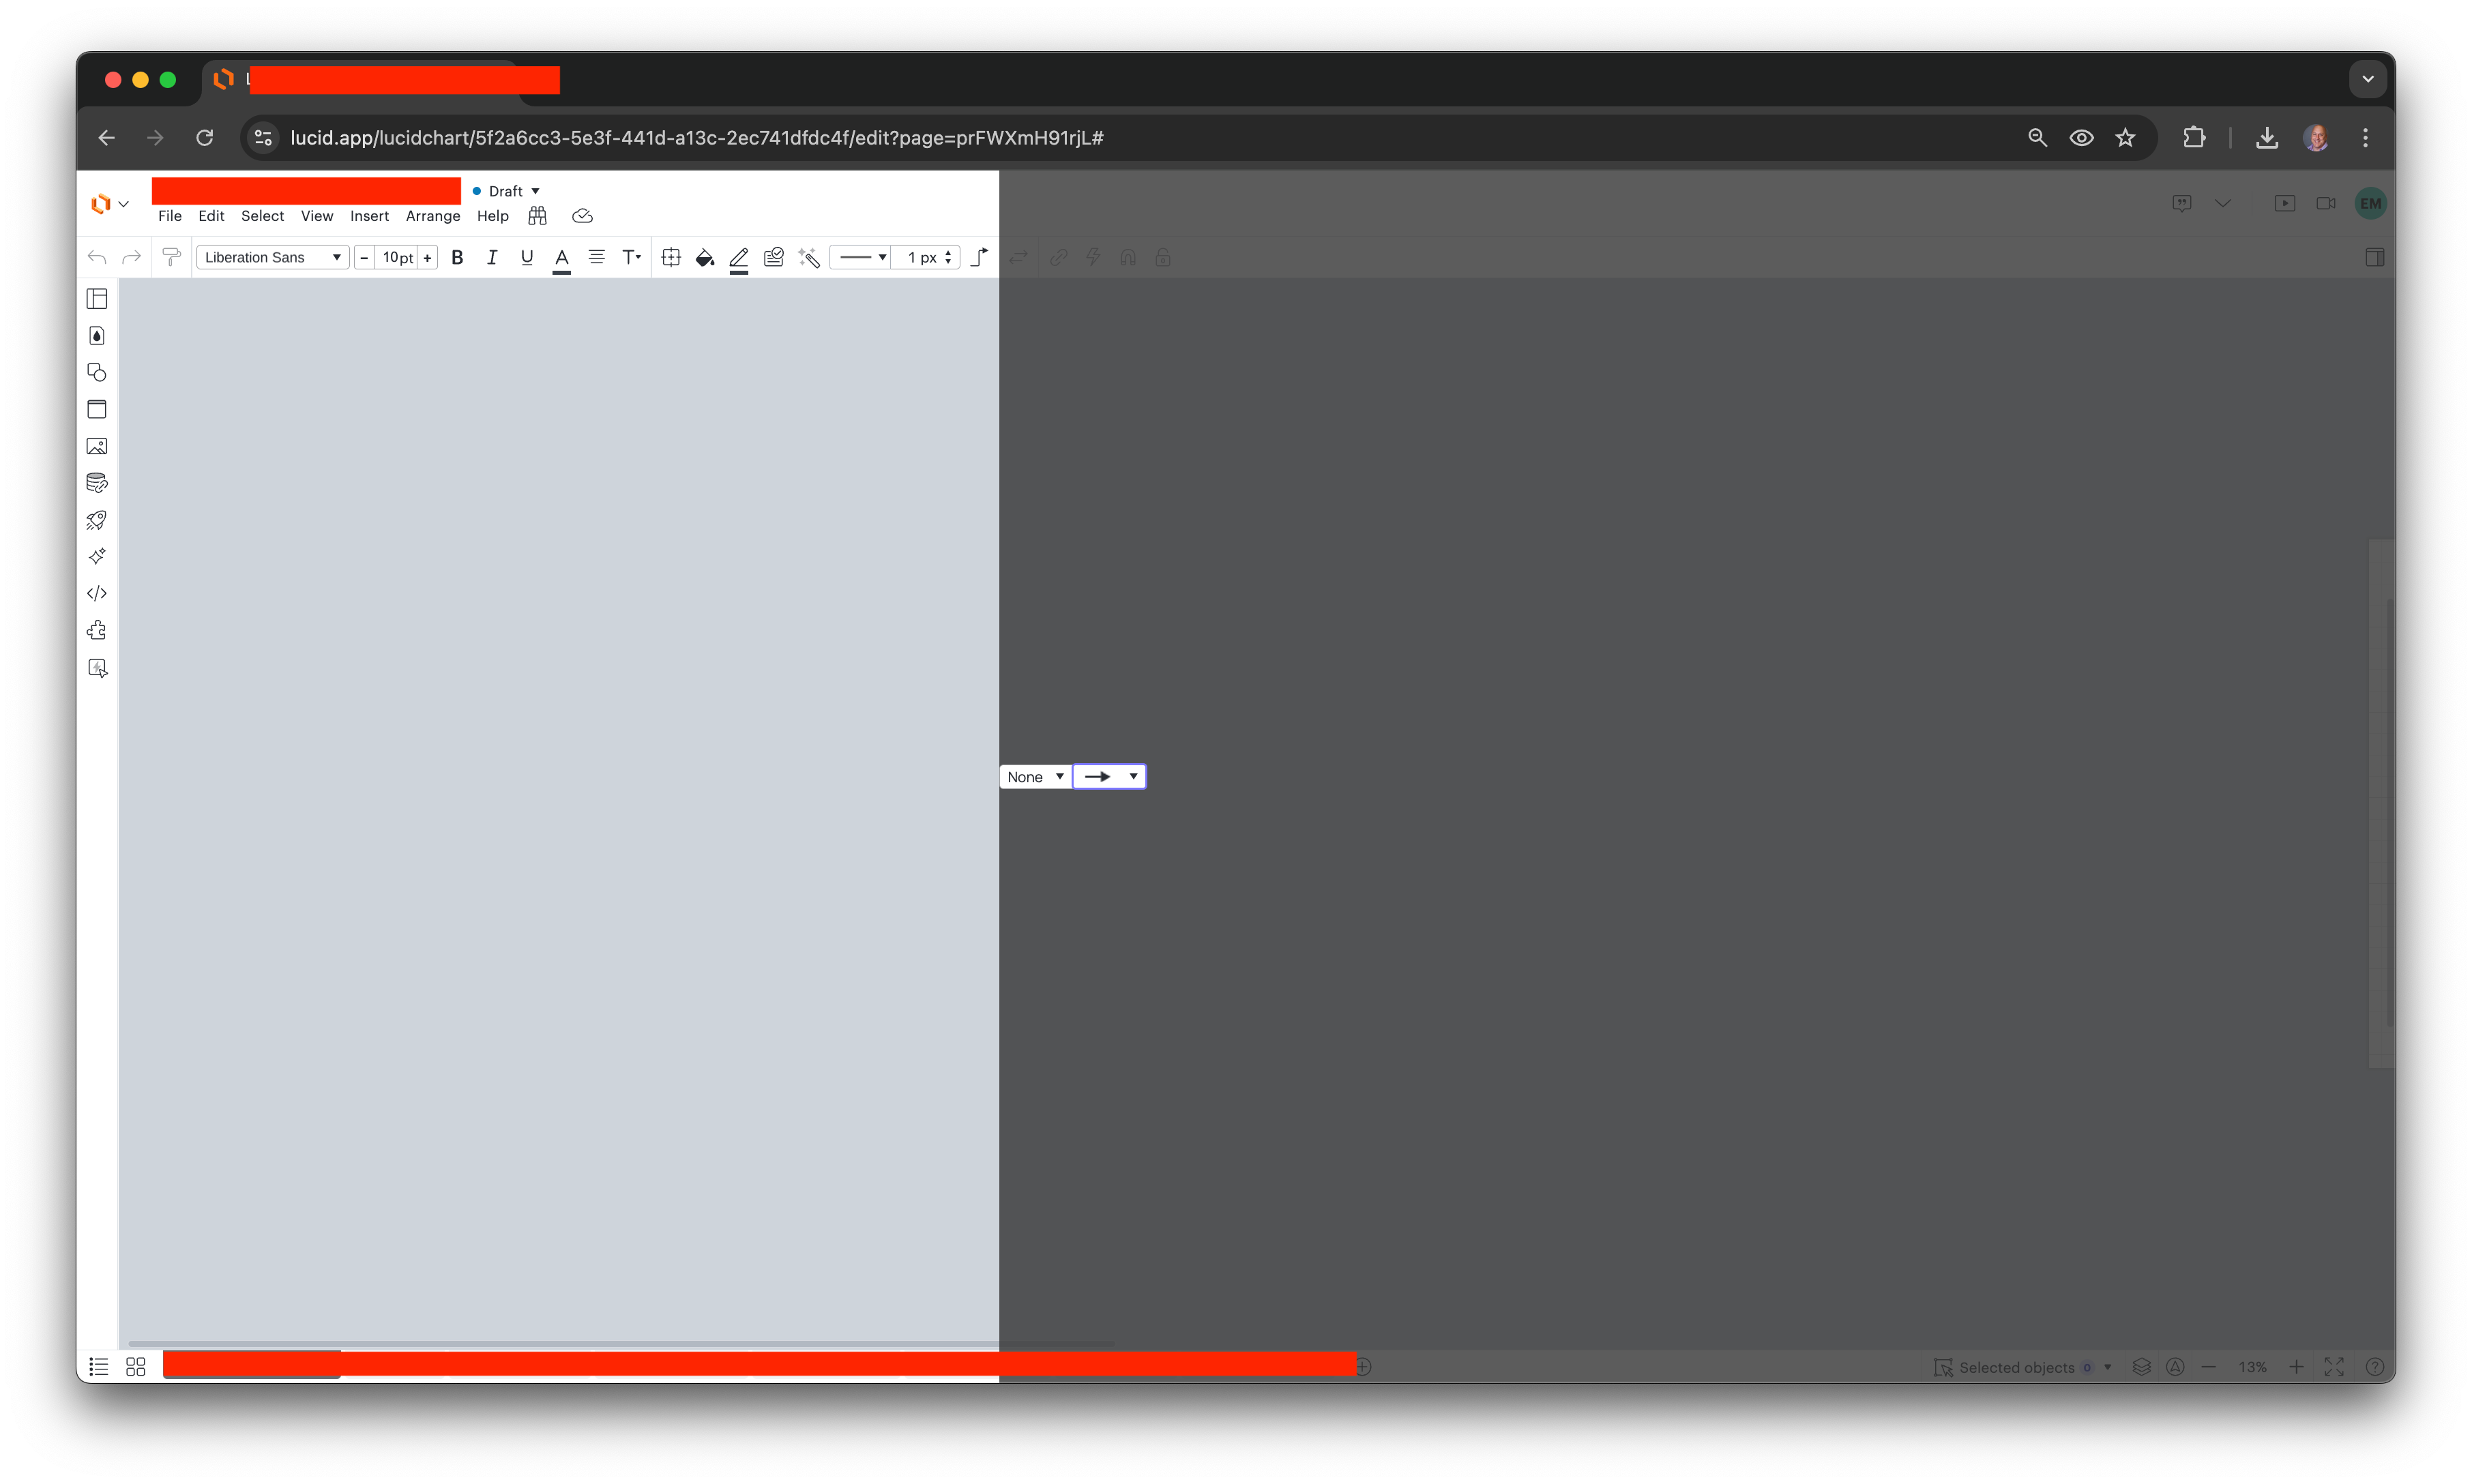
When I opened a chart I have been working on and zoomed in gray boxes were covering different areas. When I zoomed out multiple copies of pieces of the chart were everywhere. How can I fix this? Attaching screen shots:


When I opened a chart I have been working on and zoomed in gray boxes were covering different areas. When I zoomed out multiple copies of pieces of the chart were everywhere. How can I fix this? Attaching screen shots:


Hi @melissa f thank you for posting in the community! I see that you also submitted a support ticket and the looks like the issue has been resolved.
For anyone else with a similar issue I recommend trying out the basic troubleshooting steps outlined in this Help Center article.
If the issue persists please submit a support ticket via this link with a brief description of the issue and any relevant screenshots. Someone from our team will assist with troubleshooting further. Thank you!
What was the resolution? Do we need to open support ticket for the same issue? Why have the knowledge base / community if we just need to open a ticket anyways?

Hi
Taking a closer look, I can see that the issue Melissa F experienced was resolved by closing their browser and restarting their computer.
To help with the issue you’re experiencing, I recommend the following troubleshooting steps:
Please let me know if you see any improvements after trying the above steps, or if you have any questions!
A Lucid account is required to interact with the community. You will be redirected to the Lucid app to create an account.
A Lucid account is required to interact with the community. You will be redirected to the Lucid app to log in.
Enter your E-mail address. We'll send you an e-mail with instructions to reset your password.