
Hello


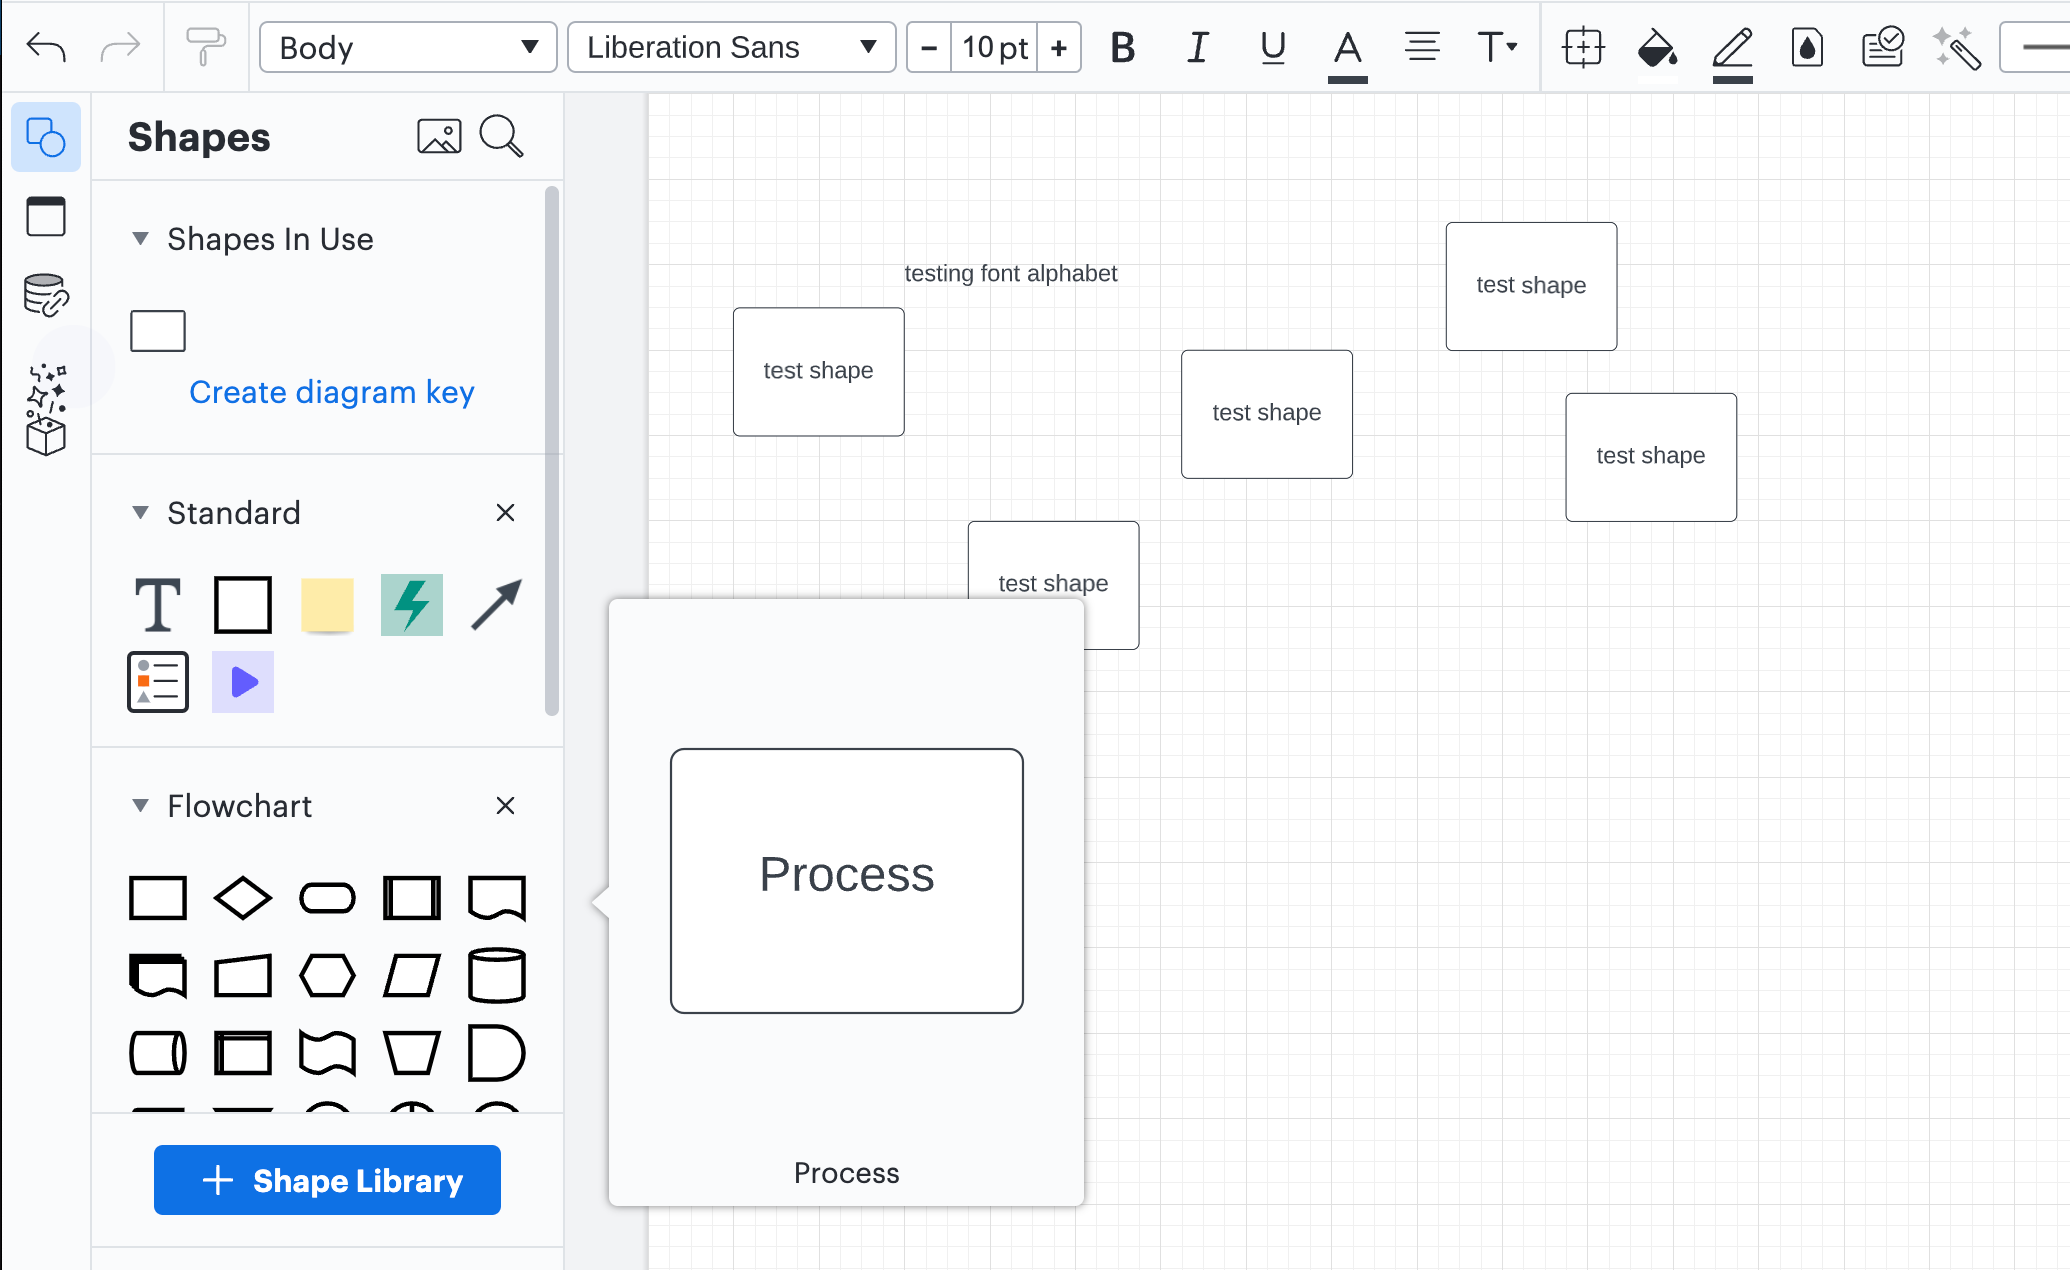
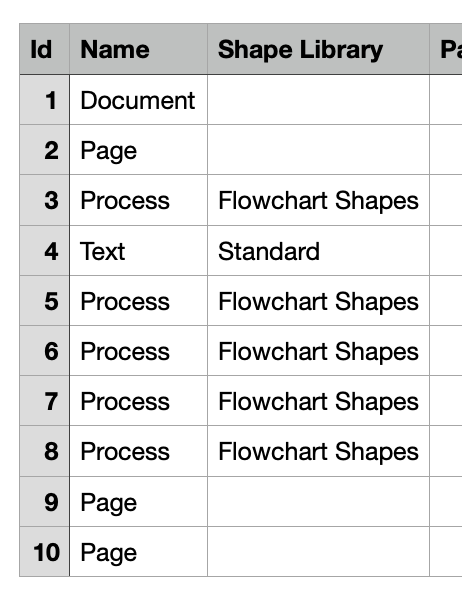
I'm building diagrams with components to be used in a project. Each shape represents a component needed and in some cases we need multiples of the same shape. I'd like to create a materials list based on the shapes used in a diagram and ideally if multiples of the same shape are used then this will automatically be indicated in the "qty" field of the CSV file.


Is this possible?


Thanks!

I've managed to setup a function in google sheets to basically combine and sum rows containing the same value (ie. SKU). No need for this functionality on Lucid side of things. 


Hi Caza thank you for contributing to the Lucid Community! The CSV export of Shape Data will have an individual row for each type of shape in the "Name" column and the shape content in the "Text Area" column. In the example screenshot and corresponding Lucidchart document you can see the multiple Process shapes appearing as "Process" in the "Name" column.


I am glad to hear that you have managed to tally the shapes in your diagram from within Google Sheets. Please let me know if you have any additional questions or concerns!


Hi! I’m Micah from Lucid’s community team. 👋 I thought you, and any others who might come across this topic in the future, might be interested in Lucid’s Data Trusted User Group. This group is made up of knowledgeable users who regularly analyze and visualize data in their work. As part of this group, you’ll have the opportunity to connect directly with Lucid’s product team, gain early access to beta features, and share insights about your needs, shaping the future of Lucid’s data solutions 🎉 You can learn more and request to join here. Thanks!


Reply