
Lucid charts has been slow, sluggish, throwing errors for a few weeks now. What happened? Please fix this. We use this every day across our organization. I use Google Chrome, nothing changed on my end. Clearly you are having performance issues on your side. Also, it definitely started one day when I received a ton of java script errors and other things due to some sort of change you made.
Solved
Experiencing slowness and performance issues in Lucidchart, seeing errors in Javascript console
Best answer by Emma B
Hi
- Can you try opening your document in a Chrome Incognito browsing session? This often improves performance by clearing your cache and cookies and disabling your extensions.
- Would you mind connecting to a different network or disconnecting from your VPN (if applicable) to rule out any connection or security issues?
- Having many page tabs, large canvases on each tab, and a high number of shapes on each canvas all increase the time it takes to load and update when changes are made. If you are working on a very large document, you may consider breaking it into several smaller documents to improve performance.
If the issue persists, please send the following information:
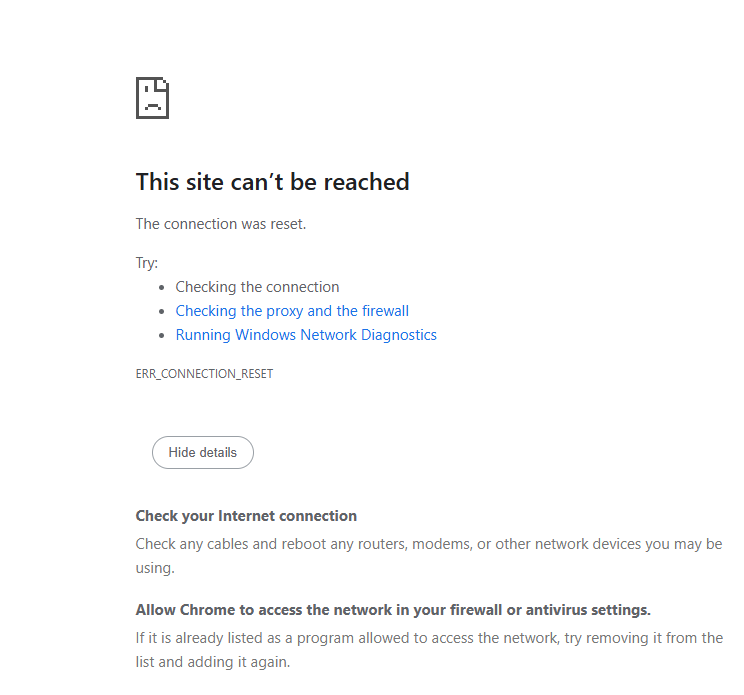
- A screenshot of any error messages or pop ups that appear.
- Is this occurring with all of your documents or just one?
- A description of any document or other changes that happened leading up to this slowness.
- A screenshot of the associated Javascript Console output after reproducing the issue. You can open your Javascript Console by pressing Ctrl+Shift+J (if your computer is a Windows/Linux) OR Cmd+Opt+J (if your computer is a Mac).
Thank you for your help and patience!


Create an account in the community
A Lucid or airfocus account is required to interact with the Community, and your participation is subject to the Supplemental Lucid Community Terms. You may not participate in the Community if you are under 18. You will be redirected to the Lucid or airfocus app to log in.
Log in to the community
A Lucid or airfocus account is required to interact with the Community, and your participation is subject to the Supplemental Lucid Community Terms. You may not participate in the Community if you are under 18. You will be redirected to the Lucid or airfocus app to log in.
Log in with Lucid Log in with airfocus
or
Enter your E-mail address. We'll send you an e-mail with instructions to reset your password.