I imported data using the org chart function with a column for FTE counts. I can write a formula when clicked into the org chart to total the FTE counts (=sum(children.'FTE') but there isn't the +T option to add a text box with that count. When I try the same formula not clicked into the org chart just the page it doesn't work. I tried LOOKUP formulas too with no success; it's like it can't read the org chart data I imported (which does not show up in the linked data panel either).


Is there a way to use formulas and add them to your document when using the org chart feature? 

Hi Amber 


Thanks for reaching out in the Lucidchart community! To accomplish what you are trying to do you will need to follow these steps: 


1. Add a text box to the page where you want the total number displayed


2. While you have the text box selected open the data panel


3. Add a custom data field to the text box and include this formula: =sum(descendants(page).'FTE')


4. Click the +T button to add that number to the text box and type whatever label you want before or after the inserted text


I hope this helps! Please let me know if you have any further questions. 


What if you don't want you text box to recalculate when you decided to condensed the view of the team?
For example: We’re encountering an issue with an org chart we are building. When a manager card is collapsed to hide the team members that work under the manager the total headcount on the table or text object reflects that change showing an inaccurate total headcount number. 


Hi Elizabeth 


Thank you for posting your question in the Lucid Community! There's another formula you can use that will not recalculate if you collapse part of your org chart. Please follow these steps to implement the formula:


1. Select the top shape or tier 1 employee in your org chart (typically the CEO President or primary leader)


2. Open the Contextual Panel select the Data tab and scroll down to Custom Data


3. Click the plus sign to create a new data field. Title it "Direct Report Count" and use this formula to calculate the value:


 =Count(DOWNSTREAMDEEP(graphnodes))

The amount of total direct reports or FTE there are up to this first employee will calculate. 
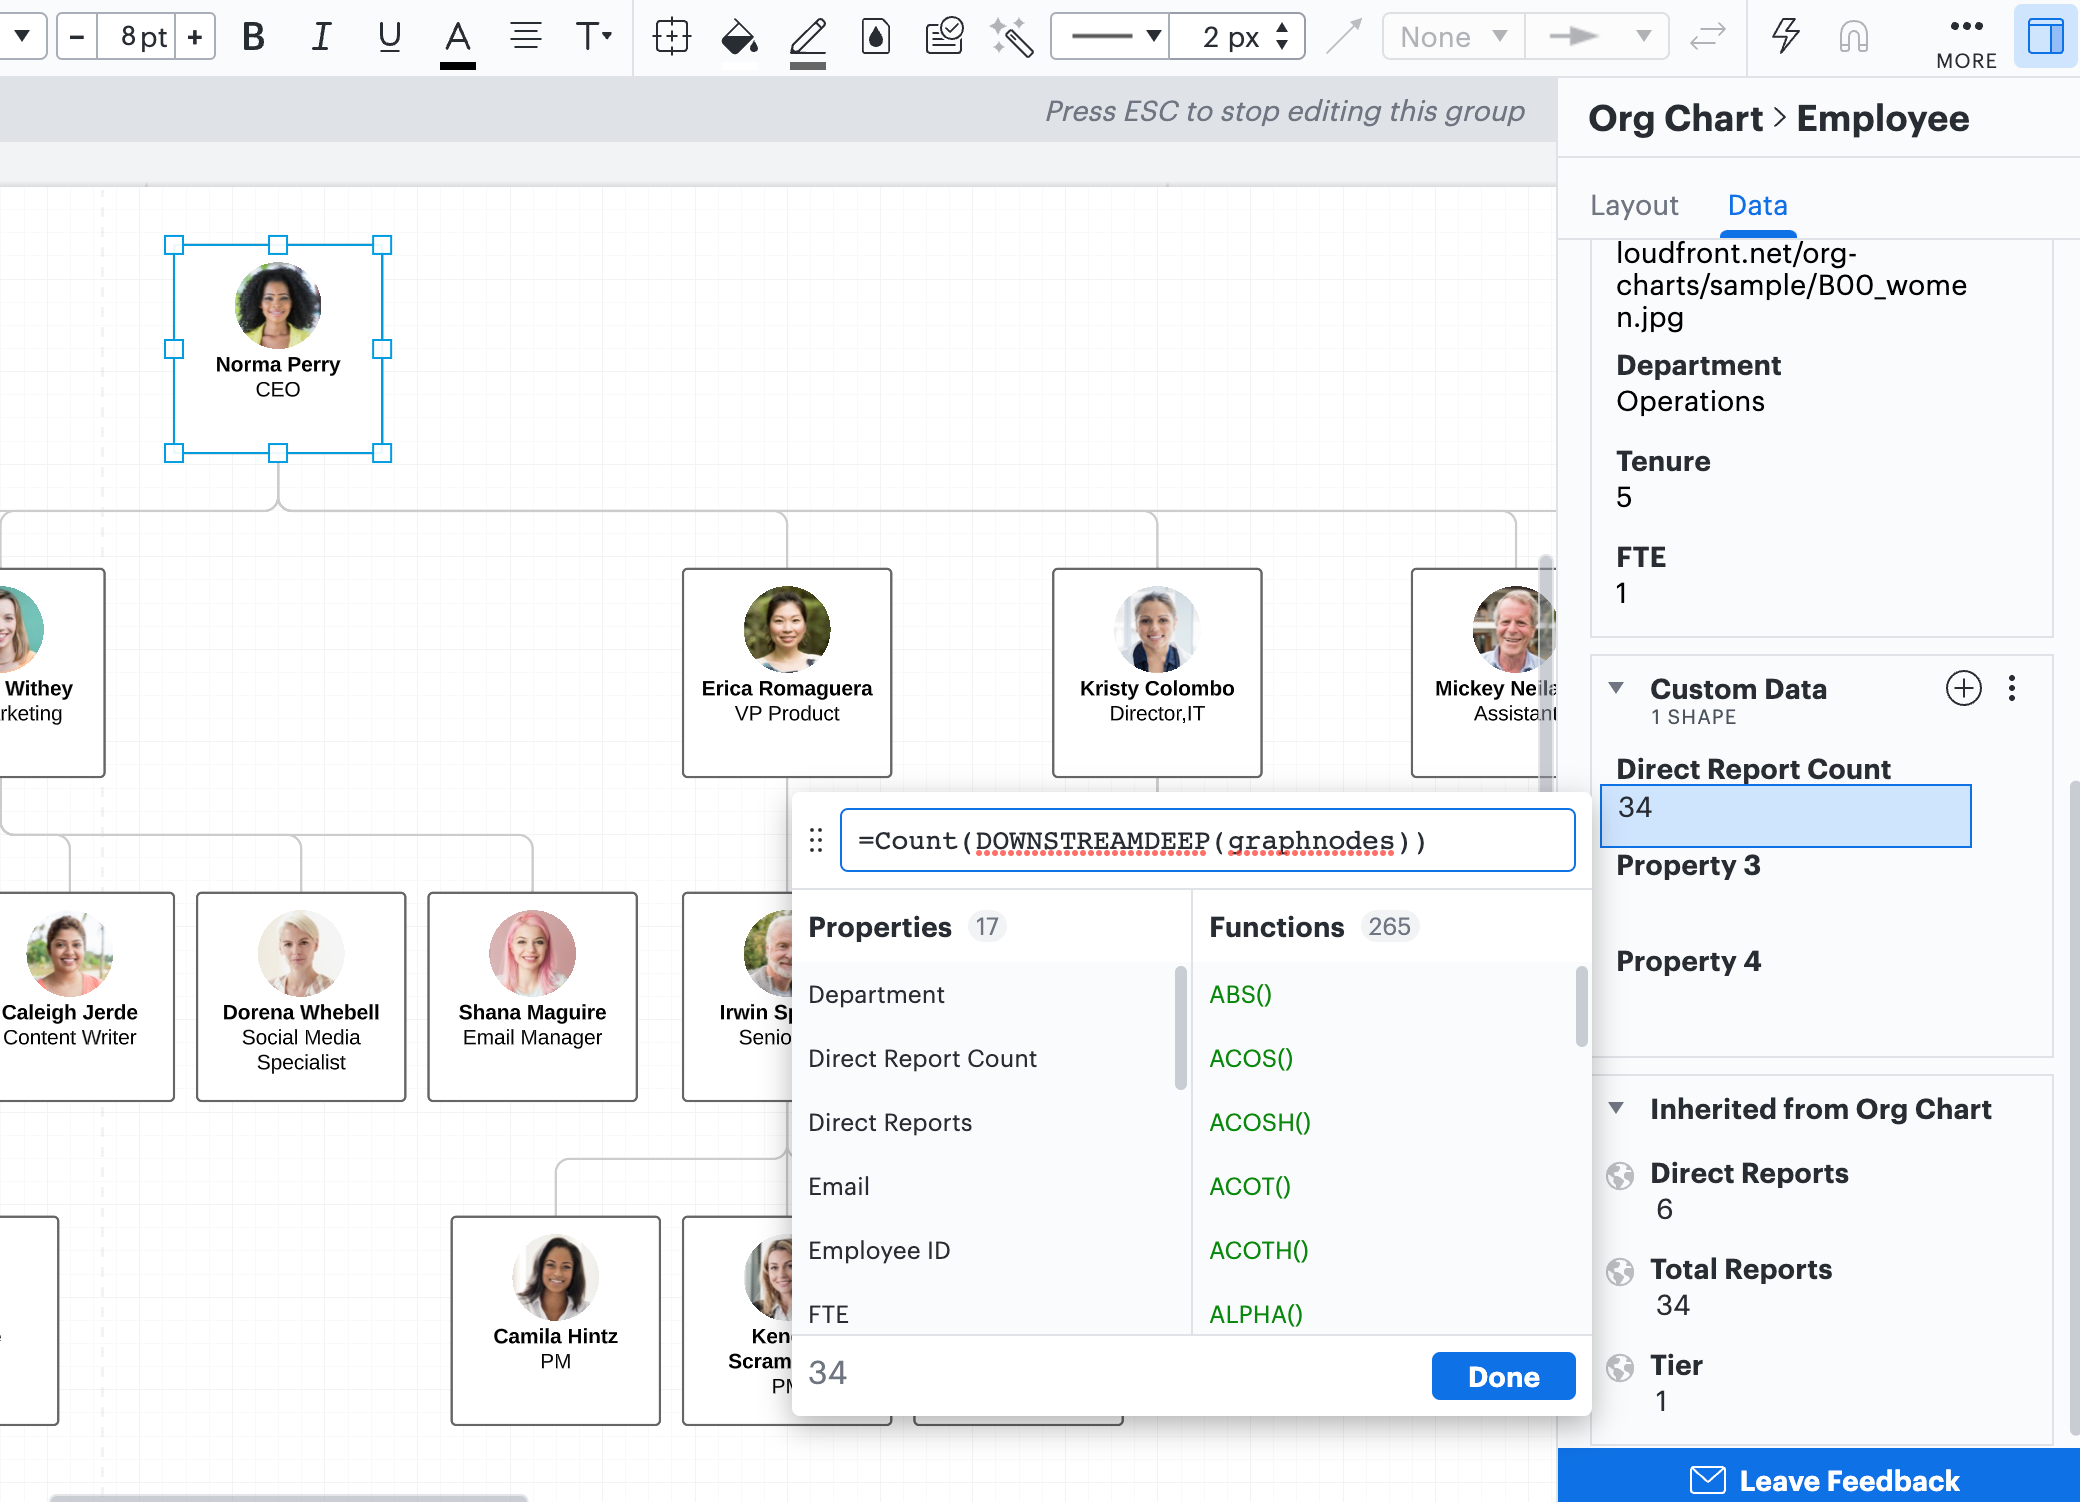


To visualize this number in a shape on your document you can use two more formulas:


The first formula will generate the name of the shape that is displaying your tier 1 employee.


1. Select the top shape or tier 1 employee in your org chart (typically the CEO President or primary leader)


2. Open the Contextual Panel select the Data tab and scroll down to Custom Data


3. Click the plus sign to create a new data field. In this data field you can title it "Name" and use the formula


=label(this) 

to generate the shape's name. Copy this "name" (in this example the generated name is: AVmTdNukrIhuOSQO/RdDmlQ7rXg=) so you can use it in the next formula.
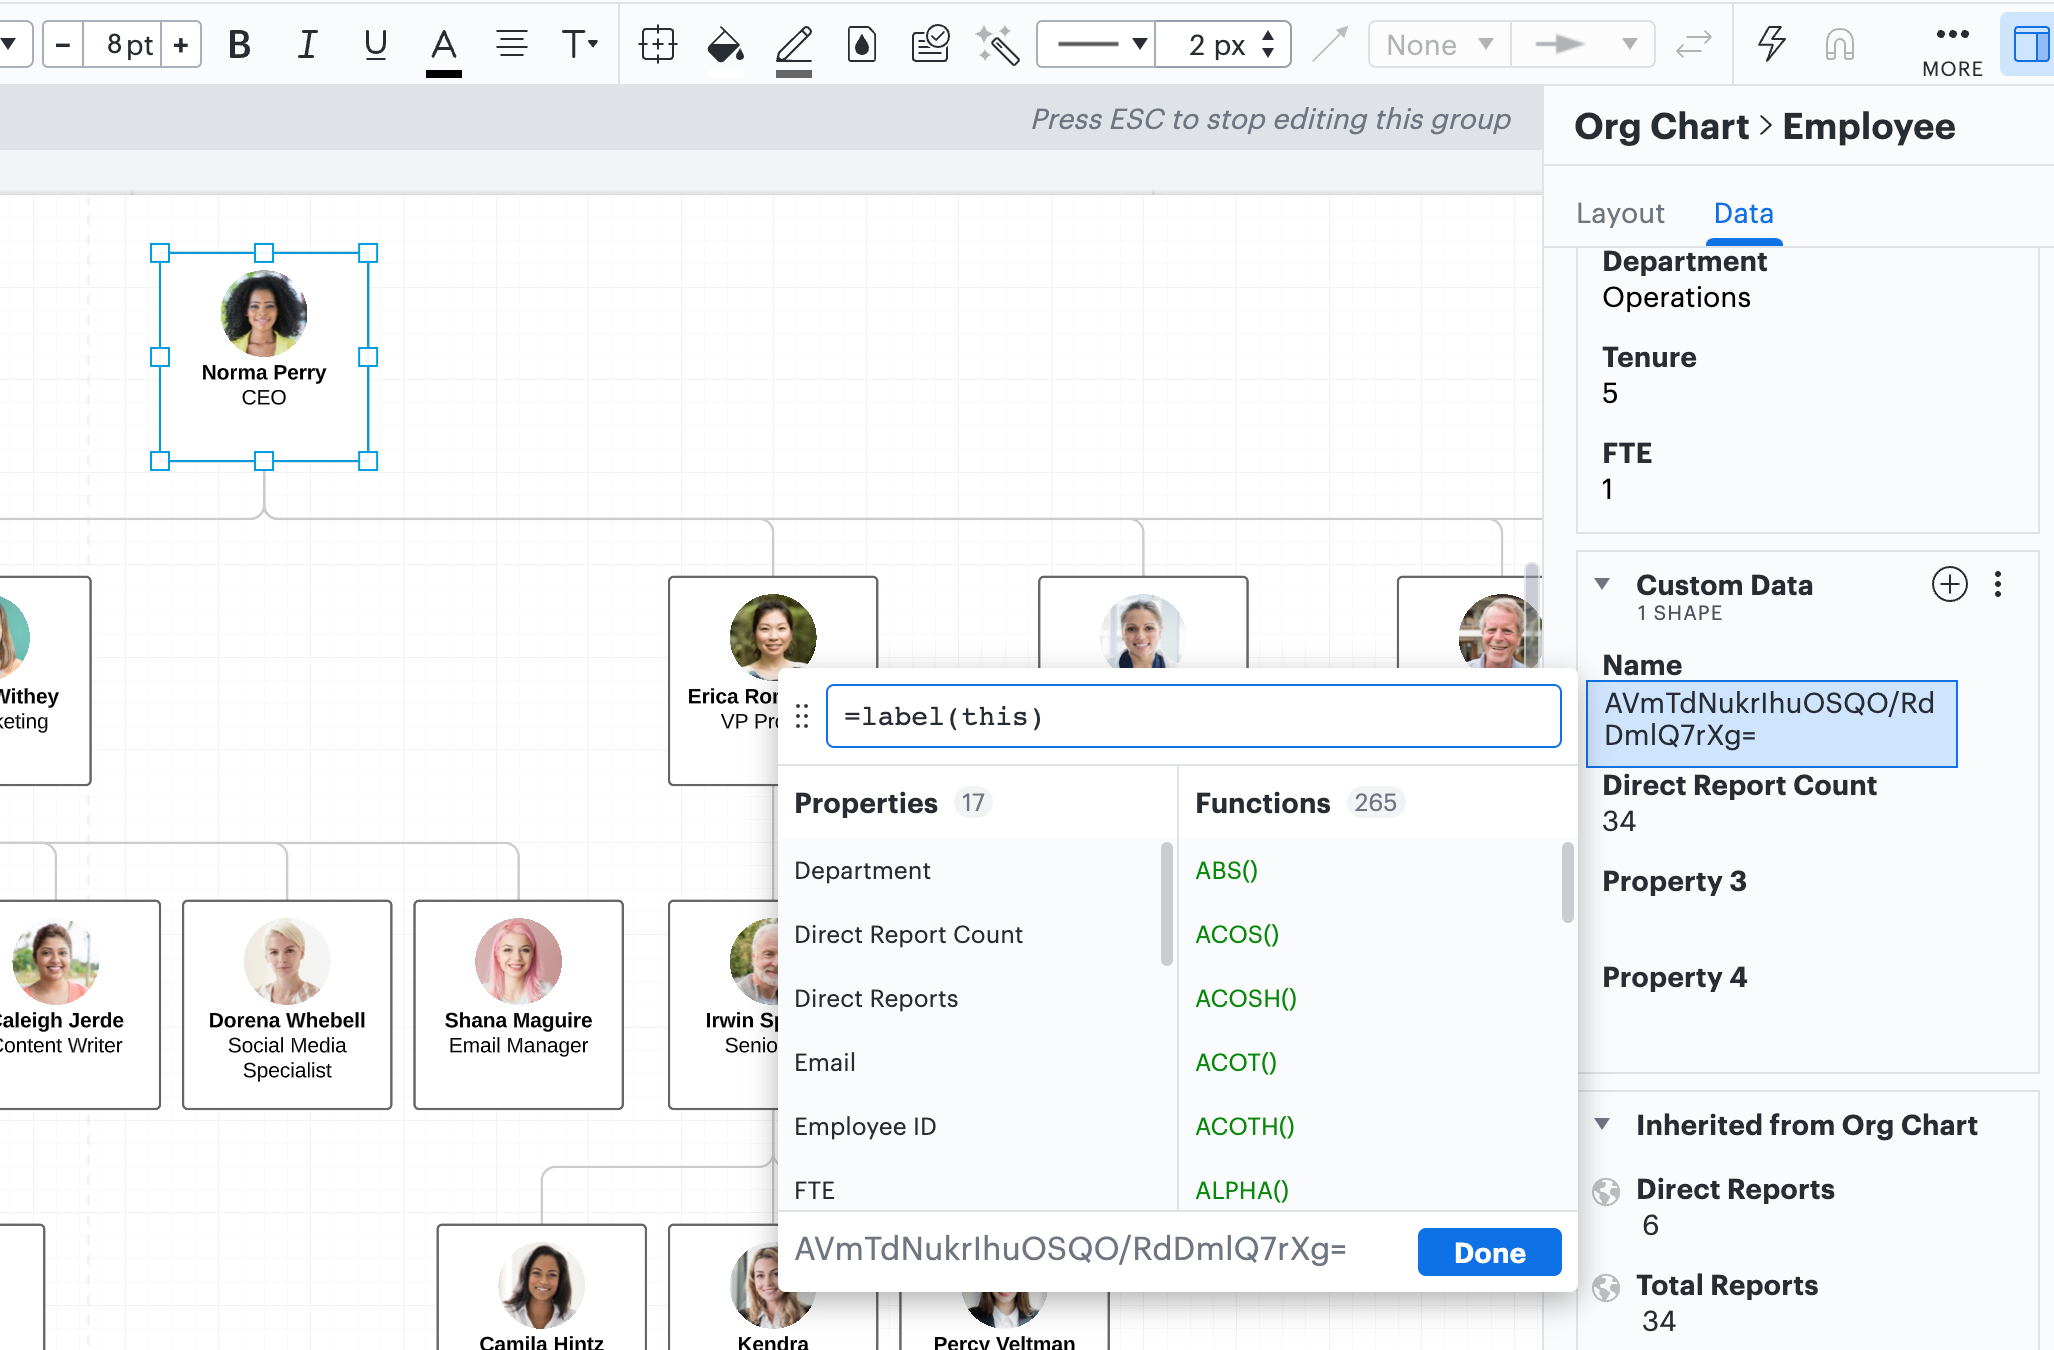


The second formula will be used to display your total FTE in a shape outside of your org chart.


This formula is not contingent on which shapes are visible and won't change if you collapse or expand parts of your org chart. 


1. Select the shape


2. Open up the shape's contextual panel select the Data tab and open up Custom Data


2. Create a new data field and use the formula: 


=#"paste the shape's name here"."Direct Report Count"

3. To visualize this value you can select the T+ on the righthand side of the data field to see it displayed in your shape
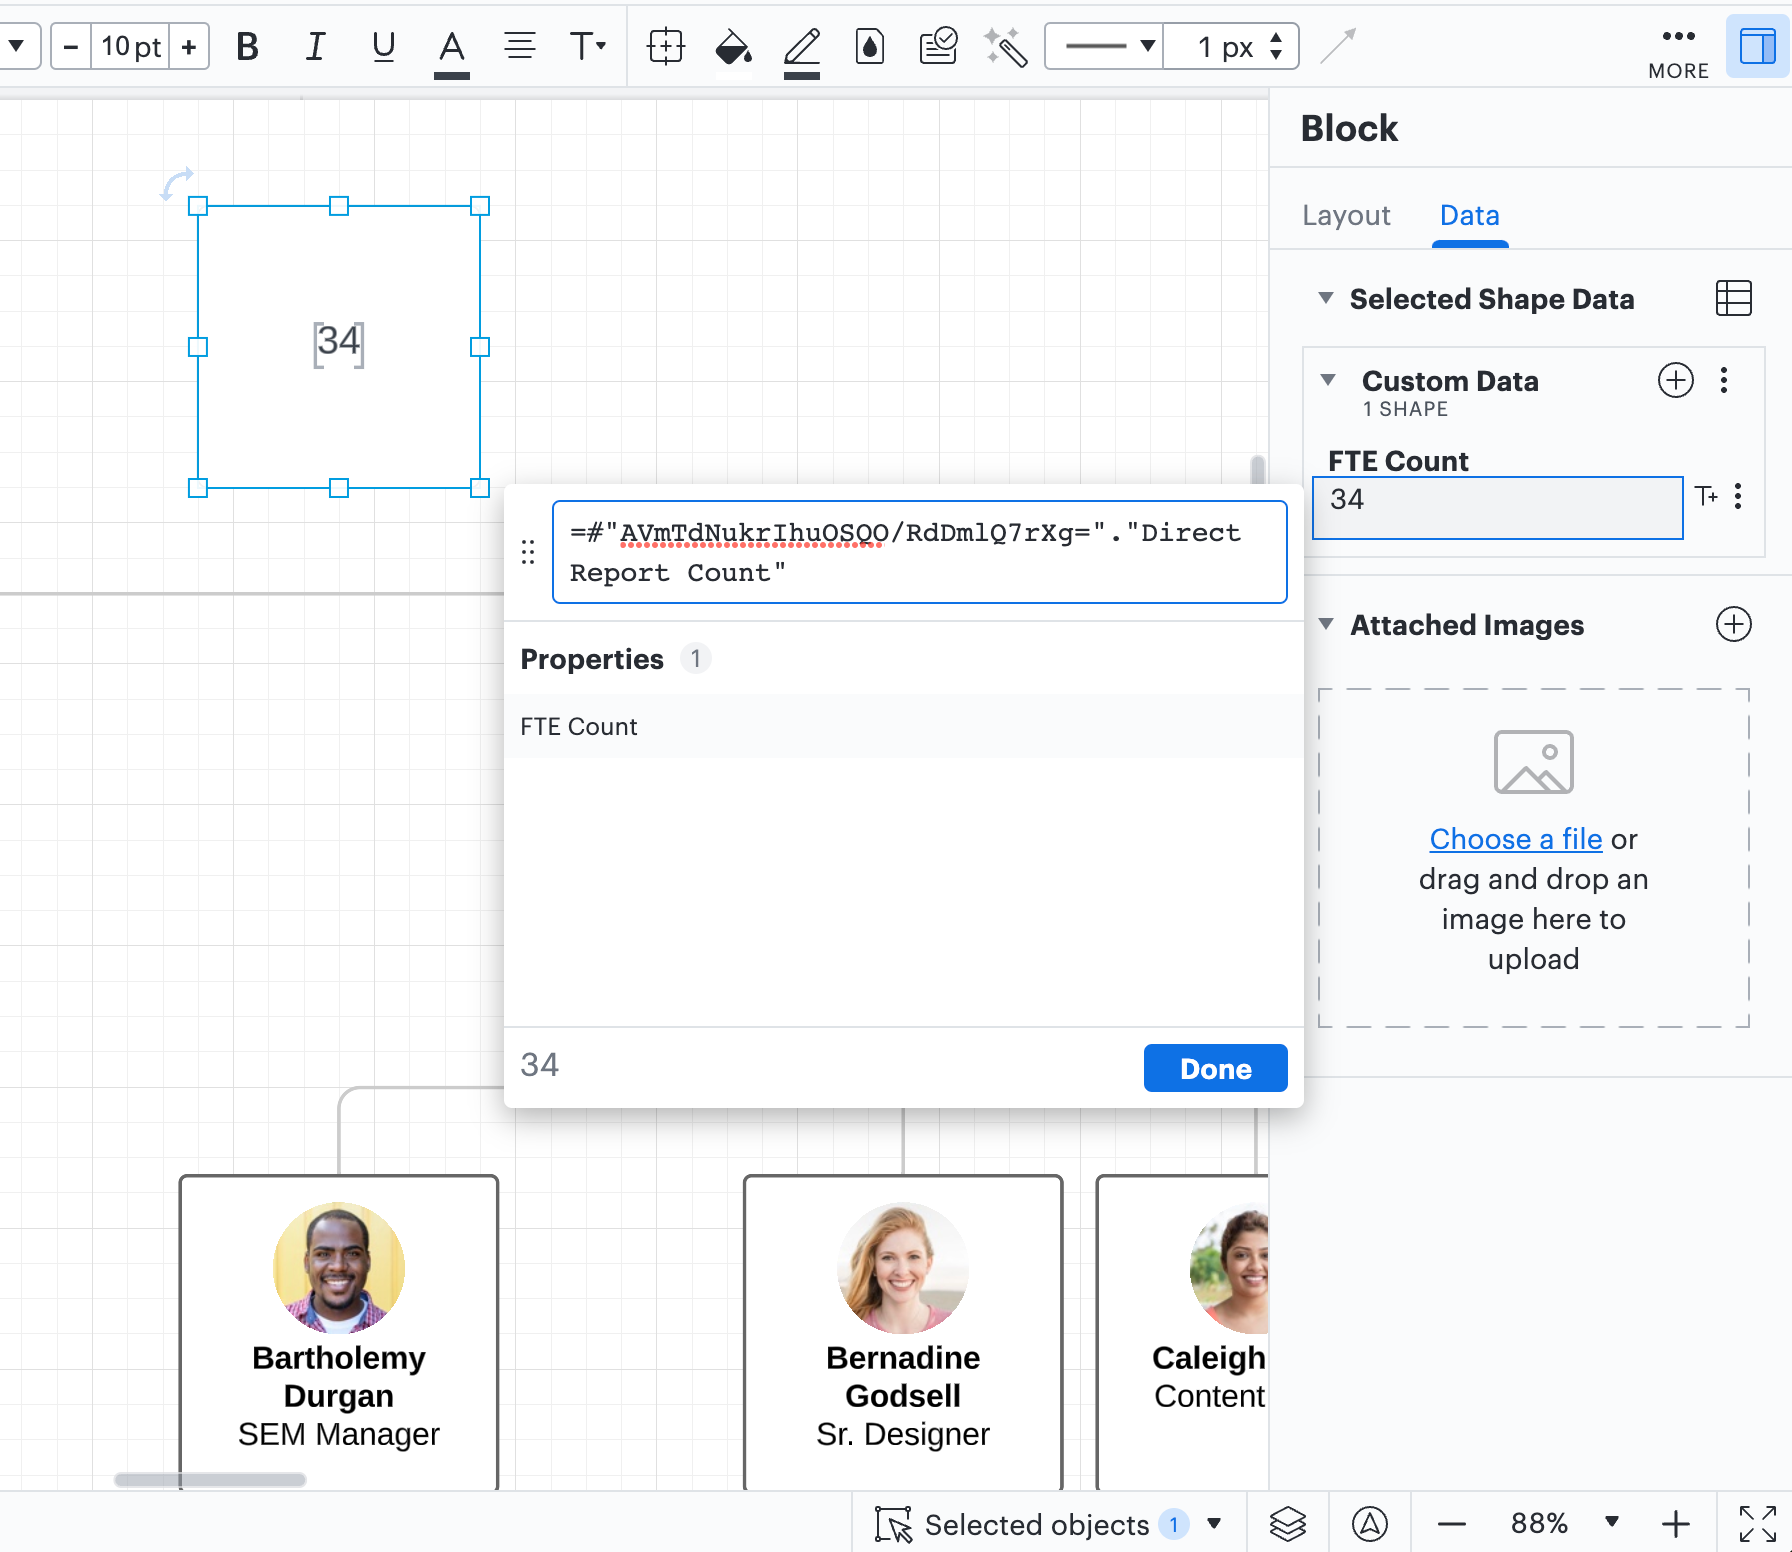


I hope this helps! Please let me know if you have any additional questions.


What if we wanted to count all employees in a specific region? We were thinking about just directly linking the data to our to avoid the change in counts when the org chart is expanded or collapsed. 


If I want to run calculations on the org chart (number of full time employees that are active and in the US) do I need to do this by selecting the first shape or selecting the entire org chart. I also noticed my first shape isnt actually included in the total count. so it will show direct downstream reports and the count but it needs to include the count of the first shape.


my amounts are still changing outside of the org chart shape. Do you have another solution?


Hi Elizabeth

Thank you for your response! To best help you troubleshoot it will be most beneficial to take a closer look at your org chart to address your questions. Due to the potentially sensitive nature of your document I've created a support ticket. Please refer to your email for further communication! 


Hi! I’m Micah from Lucid’s community team. 👋 Jumping in here to share about Lucid’s Data Trusted User Group. This group is made up of knowledgeable users who regularly analyze and visualize data in their work. As part of this group, you’ll have the opportunity to connect directly with Lucid’s product team, gain early access to beta features, and share insights about your needs, shaping the future of Lucid’s data solutions 🎉 You can learn more and request to join here. Thanks!


Reply