I've read the great article on how to create a dynamic dashboard but I'm still missing something (probably obvious). I've assembled a few dynamic and standard shapes together into this dashboard element and have tied it to a Google Sheets doc. When I change the values in the first data row everything looks great - sliders & meters reflect the values in the spreadsheet row conditional formatting changes colors. All good.
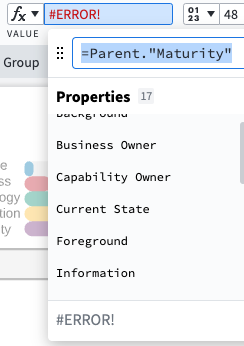
 However when I save those grouped shapes as a Custom Shape that I want to reuse over and over on my dashboard things stop working for me. I drag the custom shape onto my canvas and it reflects the values from Row 2 (Row 1 is my header row in the spreadsheet). So I grab Row 3 from the Data Linking area in the upper-left drag it onto the custom shape and see all of the linked data updated successfully in the Group > Data section on the right. But all of the meters and sliders and custom formatting and text labels all stay the same and don't reflect the new data. When I click into a subcomponent of the grouped custom shape (e.g. the People slider) I can see that it's still linked to Row 2 despite the grouped shape being now linked to Row 3's data.
Hope this makes sense. How do I ensure that the subcomponents of a grouped shape are tied to the right row in my spreadsheet? I've been able to make this work in the past - I could drag a row from the Data Linking pane to the canvas choose the custom shape that I wanted to represent it and it would just work.
If I have to drag each cell from the correct row onto each subcomponent then it would actually take more time than just manually changing the text on the diagram.